
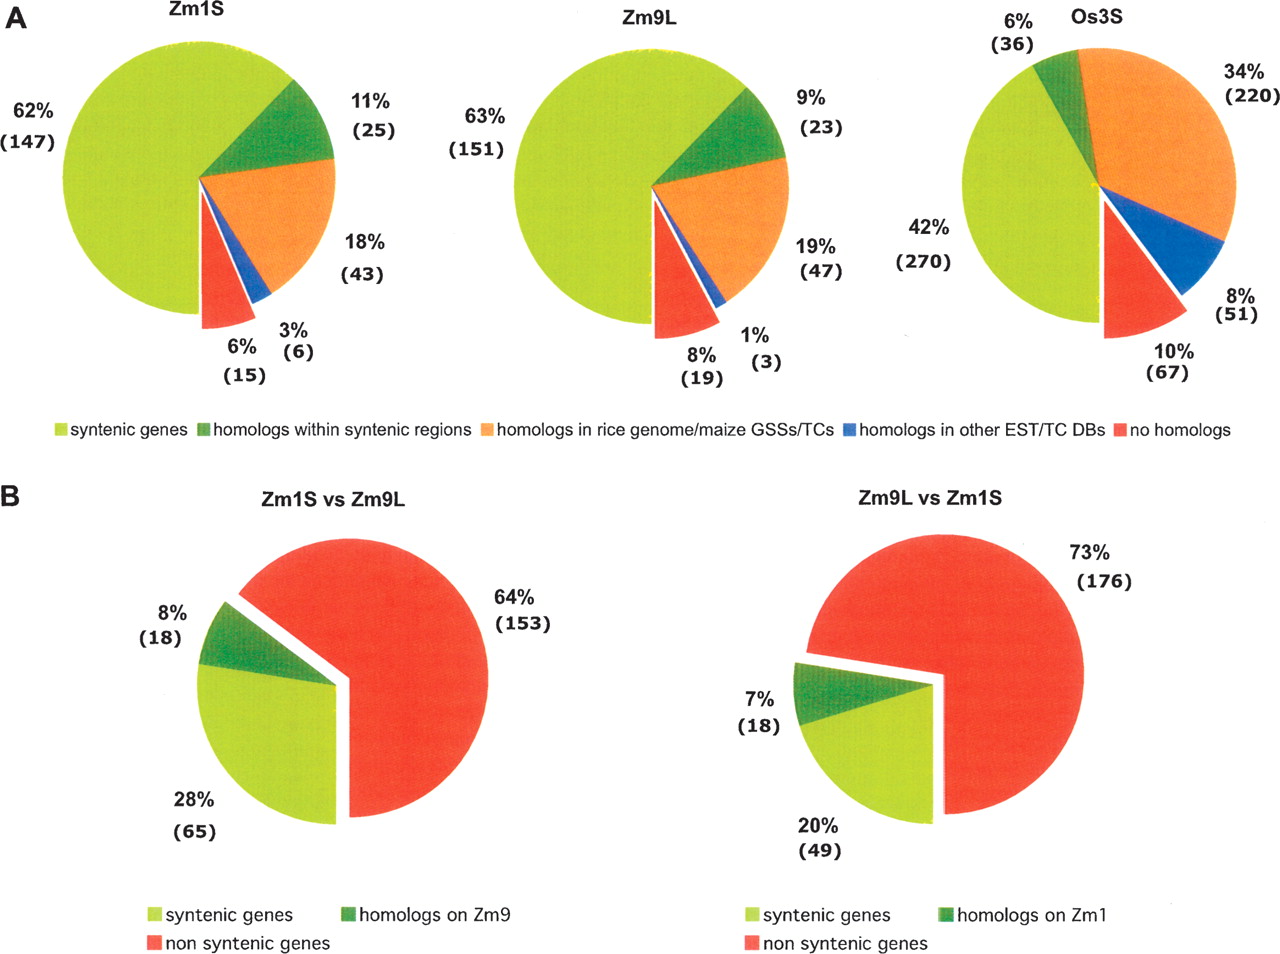
Figure 2.
Corresponding, syntenic genes between the Zm1S, Os3S, and Zm9L chromosomal regions. Gene models for all three regions were determined as described in the text. A graphic representation is given for genes (A) that are syntenic, have homologs within the syntenic regions, have homologs in the rice genome or maize GSSs/EST collections, have a homologous counterpart in other plant EST collections, or are species-specific; and (B) that are syntenic between both maize regions and have a homolog or no homolog on the other maize chromosome. Each fraction is labeled with the number of genes and the percentage of the total within its sample.


