
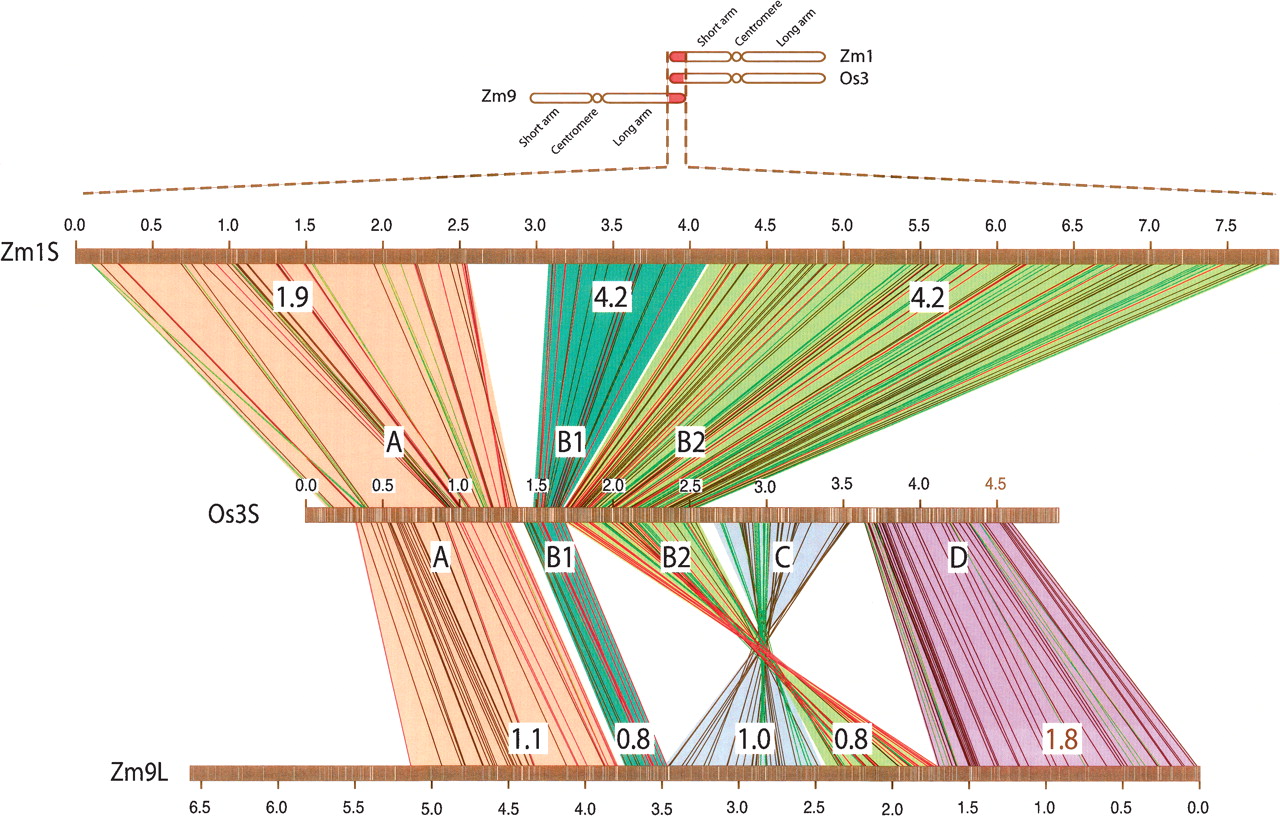
Alignments of chromosomal regions from Zm1S, Os3S, and Zm9L. The three horizontal lines with scales in million basepairs (Mb) represent the chromosomal regions from Zm1S, Os3S, and Zm9L. On these horizontal lines, the positions of the genes are marked with a white vertical bar. Above those lines, a schematic diagram shows the alignment of these regions with respect to their chromosomal locations. Vertical lines connect syntenic genes between Zm1S and Os3S, and Zm9L and Os3S, respectively. Line color indicates syntenic arrangement of genes between Zm1S–Os3S–Zm9L (red), syntenic arrangement of tandem genes (green), and syntenic arrangements of genes either between Zm1S–Os3S or between Zm9L–Os3S (black). Syntenic blocks are labeled A, B1, B2, C, and D. Syntenic blocks are interrupted by regions without corresponding genes. The expansion grade of each syntenic block with respect to rice is shown as fold expansion.


