
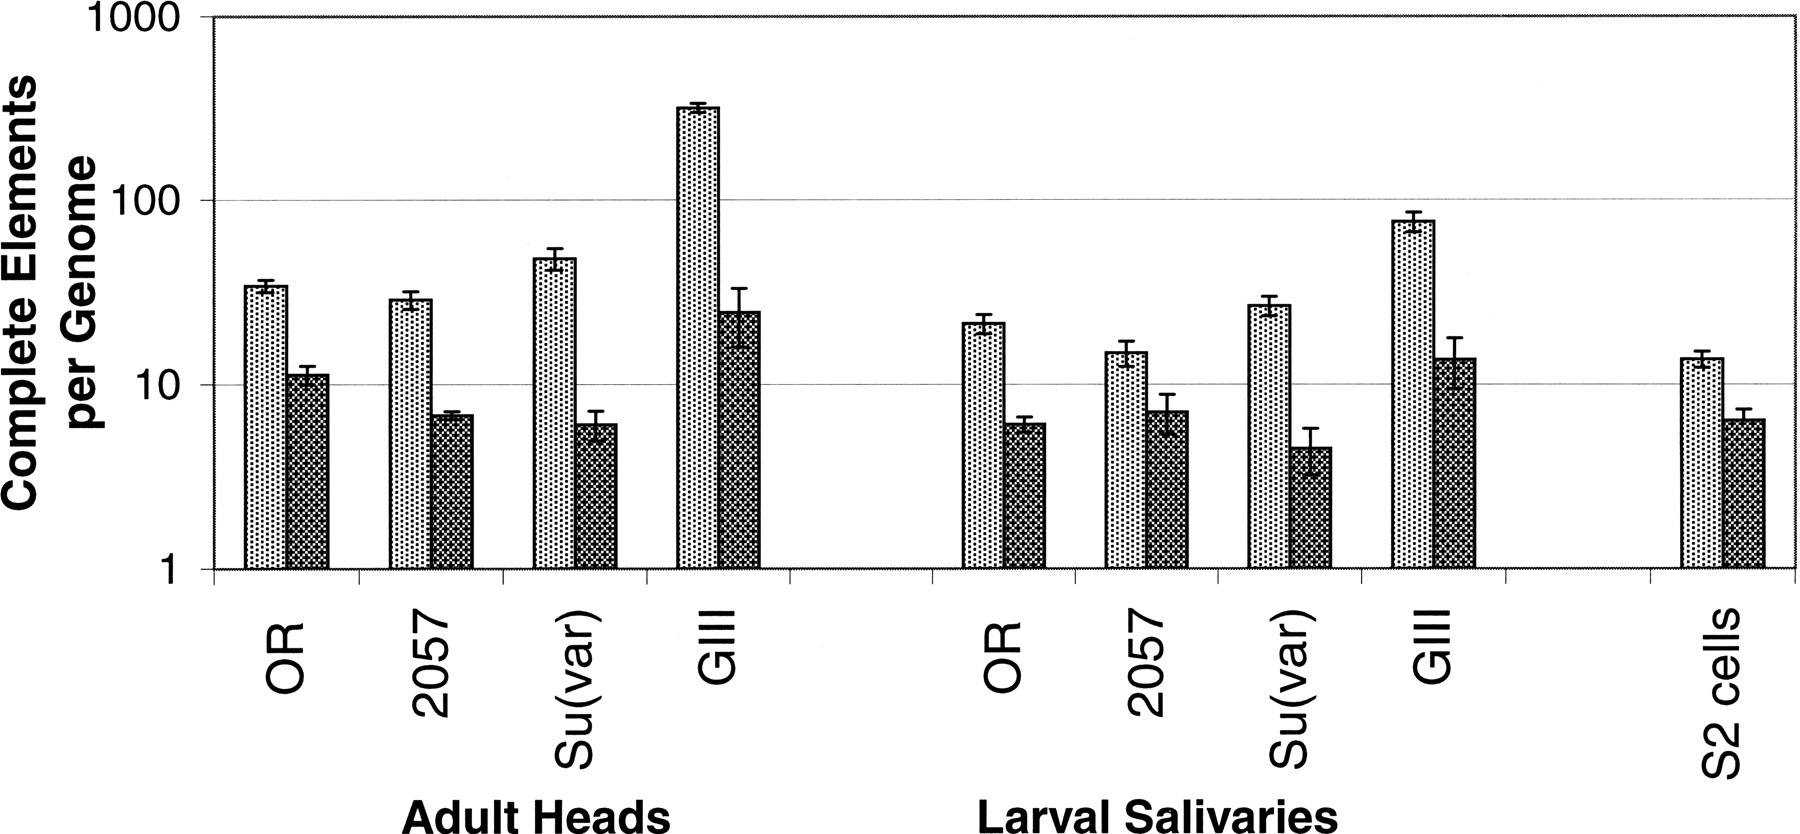
Estimated number of complete HeT-A and TART elements in D. melanogaster. Two features illustrated by this graph are the under-replication in salivary glands over a data range so wide that the vertical axis has been chosen to be logarithmic, and also the near proportionality over such a wide range in the relationship between the number of HeT-A and TART elements across different stocks and tissues (correlation coefficient, r = 0.88–0.96, P = 0.07–0.0001, depending on tissue type) (see Supplemental material, Section 3.) Less obvious, but statistically significant, is the tracking of elements in heads vs. that same element in salivary glands (r = 0.95–0.99, P = 0.05 to <0.0001). Light gray indicates HeT-A; dark gray, TART.


