
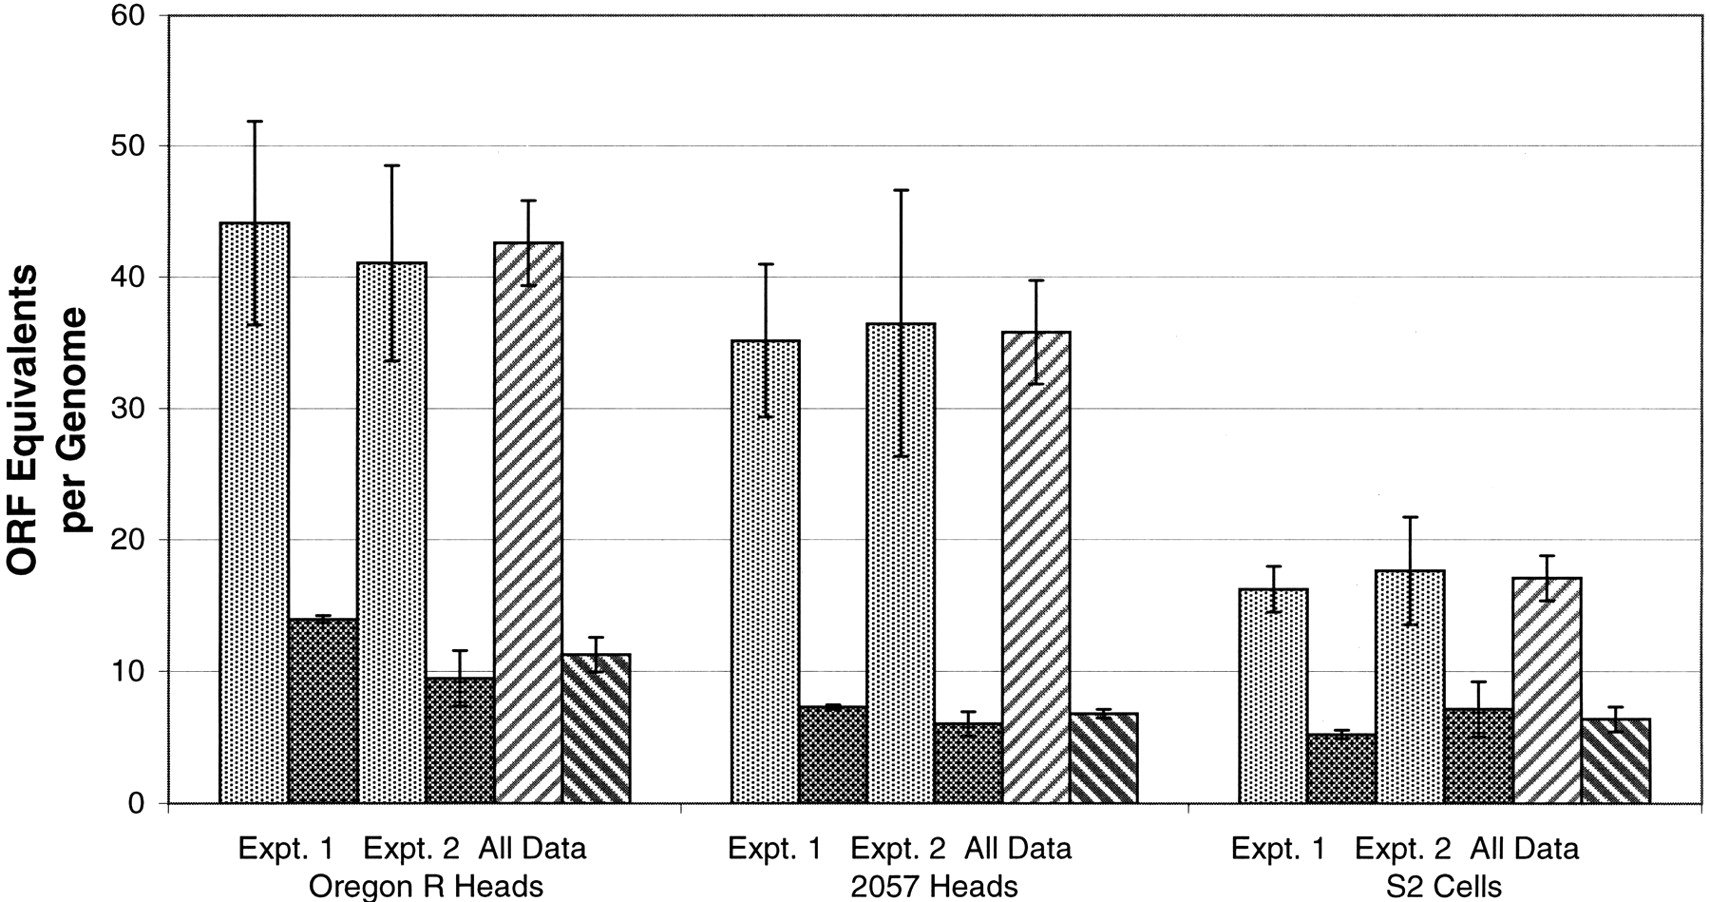
HeT-A and TART ORF equivalents in D. melanogaster. Numbers of full-length ORF equivalents were calculated from measurements of Southern blots (see Fig. 2). Data were corrected for DNA loading by first hybridizing with a probe for a single copy gene (rp49). The relative activity of the two probes (rp49 and ORF) was determined by measurement of a dose curve for each probe on the same filter. Fly DNA was prepared from adult female heads. For each DNA sample, the first four bars show the results of separate experiments, each of which averages several measurements (light gray indicates HeT-A; dark gray, TART). The final two bars (rising stripes, HeT-A; falling stripes, TART) show the results of averaging all data for that DNA. Error bars indicate the standard deviation of these averages (defined as the standard error of the underlying population).


