
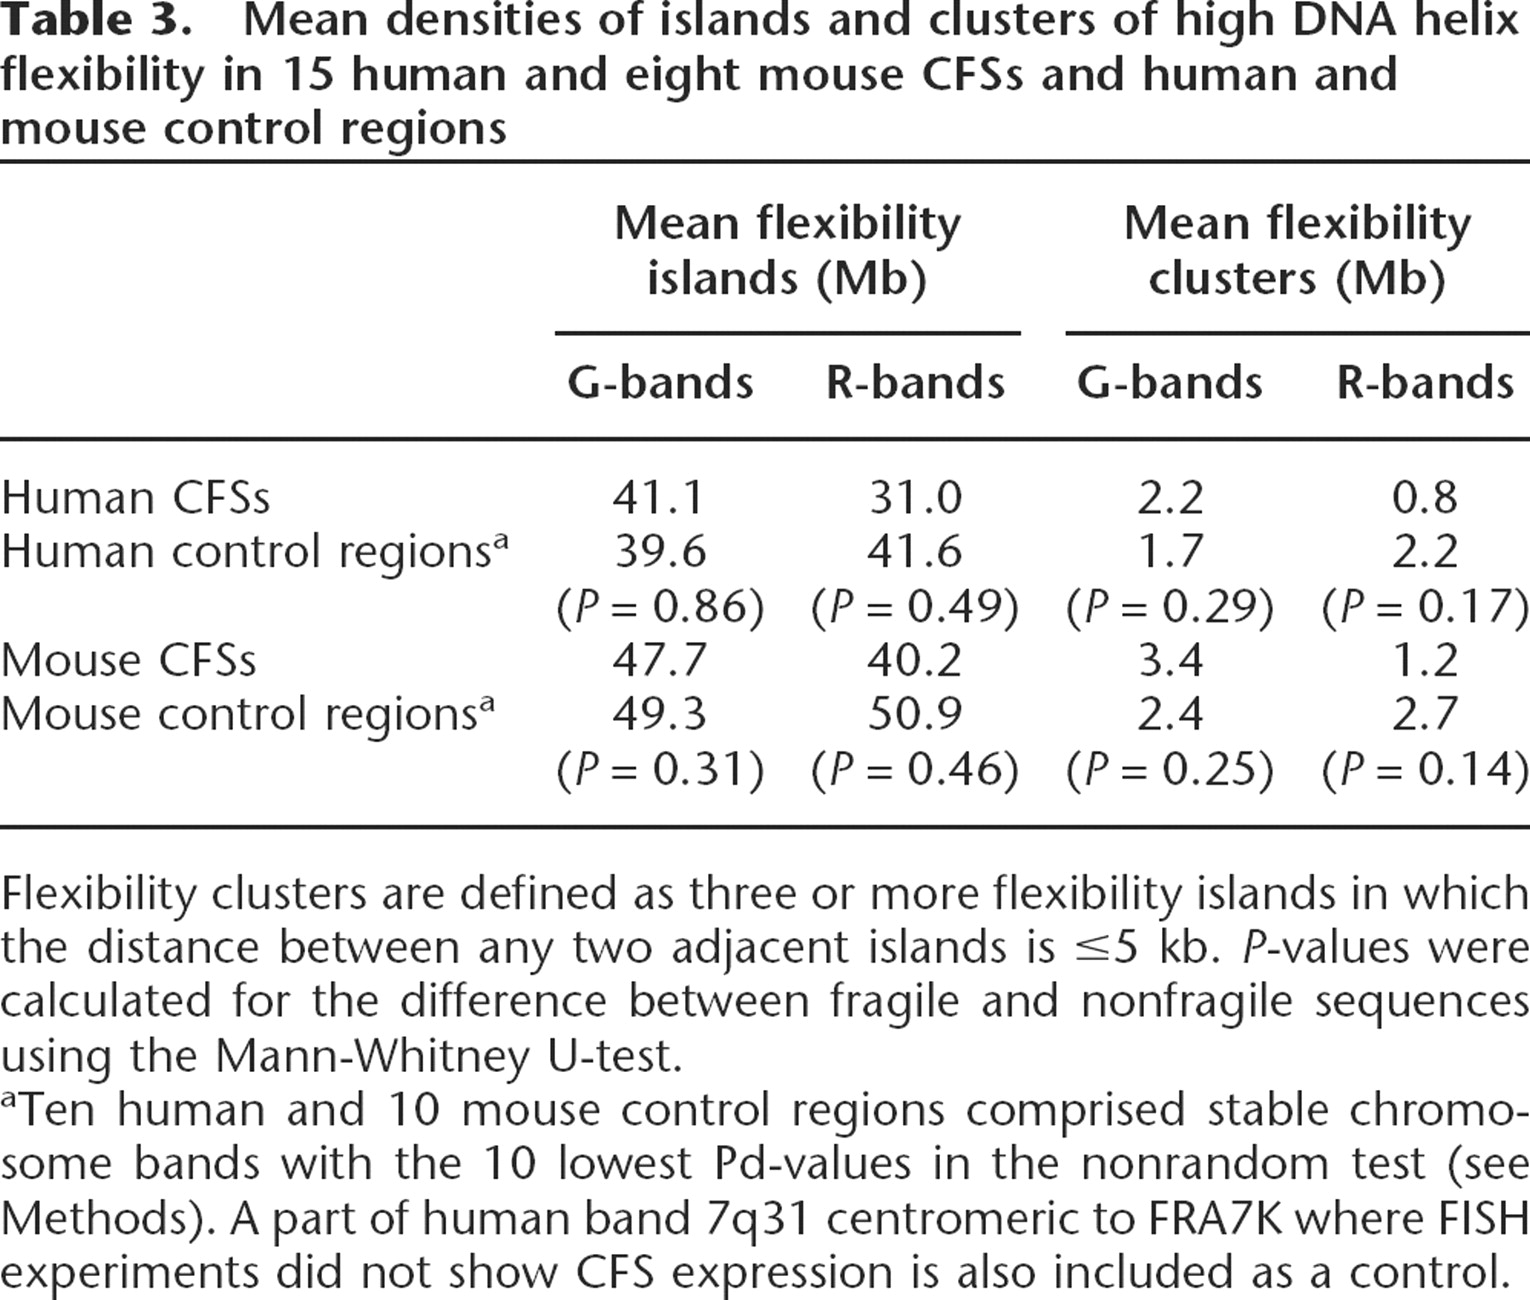
Table 3.
Mean densities of islands and clusters of high DNA helix flexibility in 15 human and eight mouse CFSs and human and mouse control regions
Click on table to view larger version.
Click on image to view larger version.
Mean densities of islands and clusters of high DNA helix flexibility in 15 human and eight mouse CFSs and human and mouse control regions
Click on table to view larger version.
 CiteULike
 Delicious
 Digg
Digg Facebook
 Google+
 Reddit
 Twitter
