
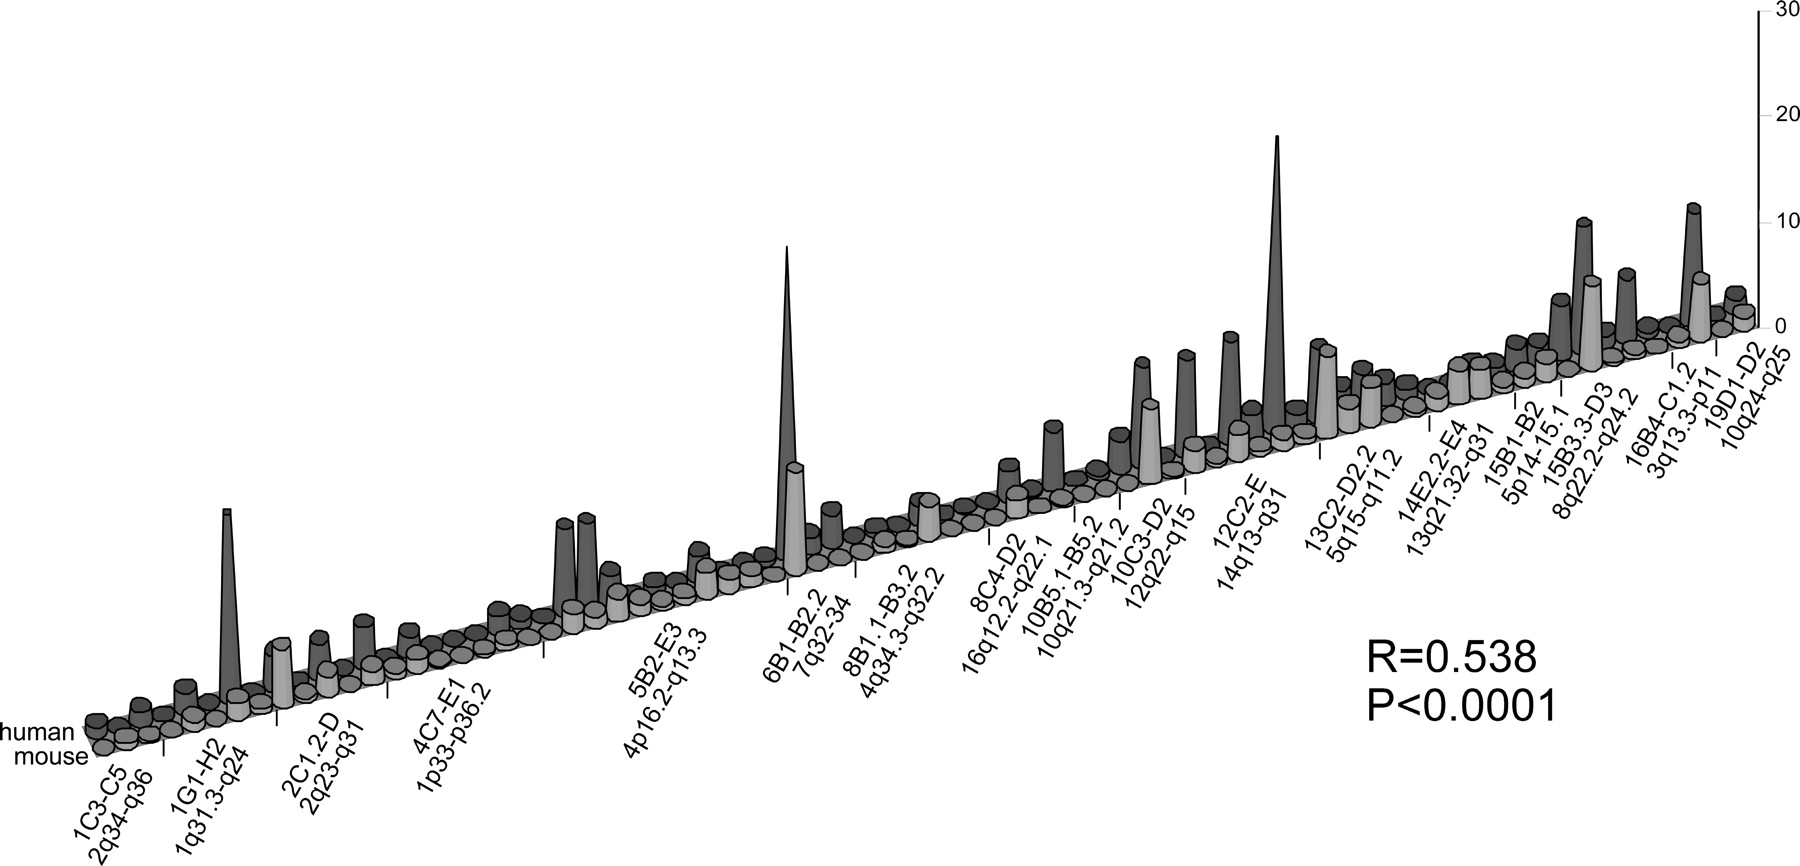
Figure 5.
CFS expression levels in chromosome bands of 17 large (two or more cytogenetic bands) syntenic regions of the human and mouse (BALB/c and C57BL/6) genomes. x-axis: mouse and human chromosome bands; y-axis: frequency of CFS expression in percentages.


