
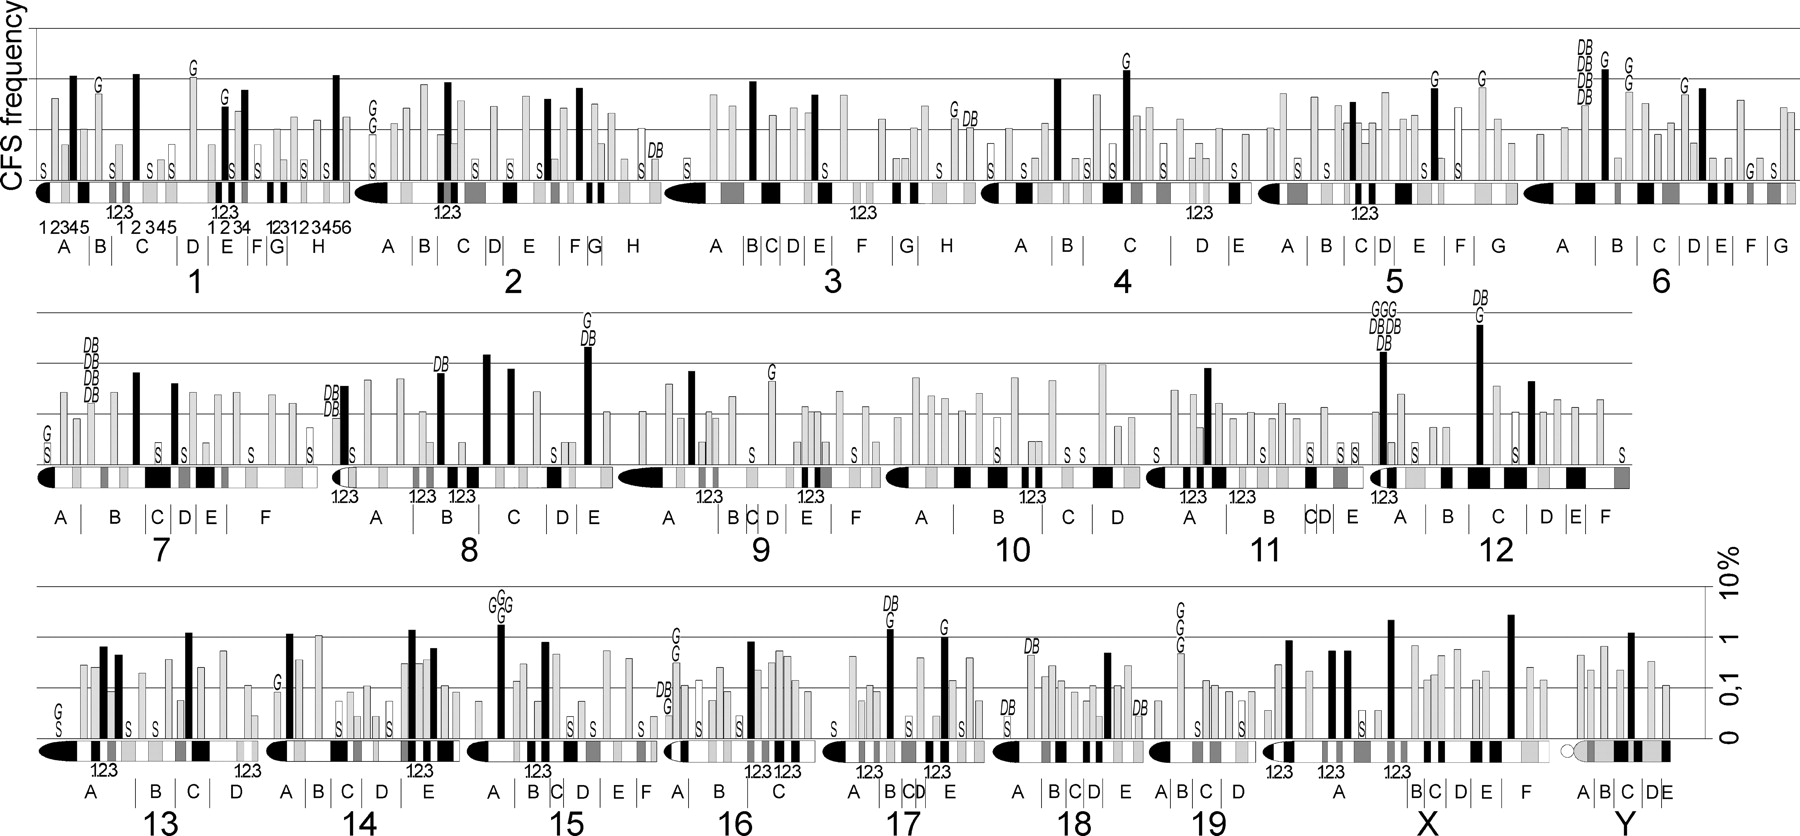
Log scale CFS expression levels in 392 mouse chromosome bands. The mouse chromosome ideogram (D. Adler, Department of Pathology at the University of Washington, supplemented according to http://www.ensembl.org/Mus_musculus/index.html) is displayed horizontally. All chromosome bands (A–H), sub-bands (1–6), and sub-sub-bands (1–3) are labeled for chromosome 1; sub-bands of the remaining chromosomes are, for the sake of clarity, not labeled and can be identified according to their position within chromosome bands and in relation to the indicated sub-sub-bands. CFS expression data were obtained in BALB/c and C57BL/6 splenocytes treated with 0.2 μM and 0.4 μM APC and are shown as the percent of analyzed chromosomes. Stable chromosome bands (S, white bars) with low APC sensitivity and bands with medium (gray) and high (black) CFS expression were identified with a nonrandom test (see Methods). Each spontaneous gap (G) and double-strand break (DB) found in untreated control cells are indicated.


