
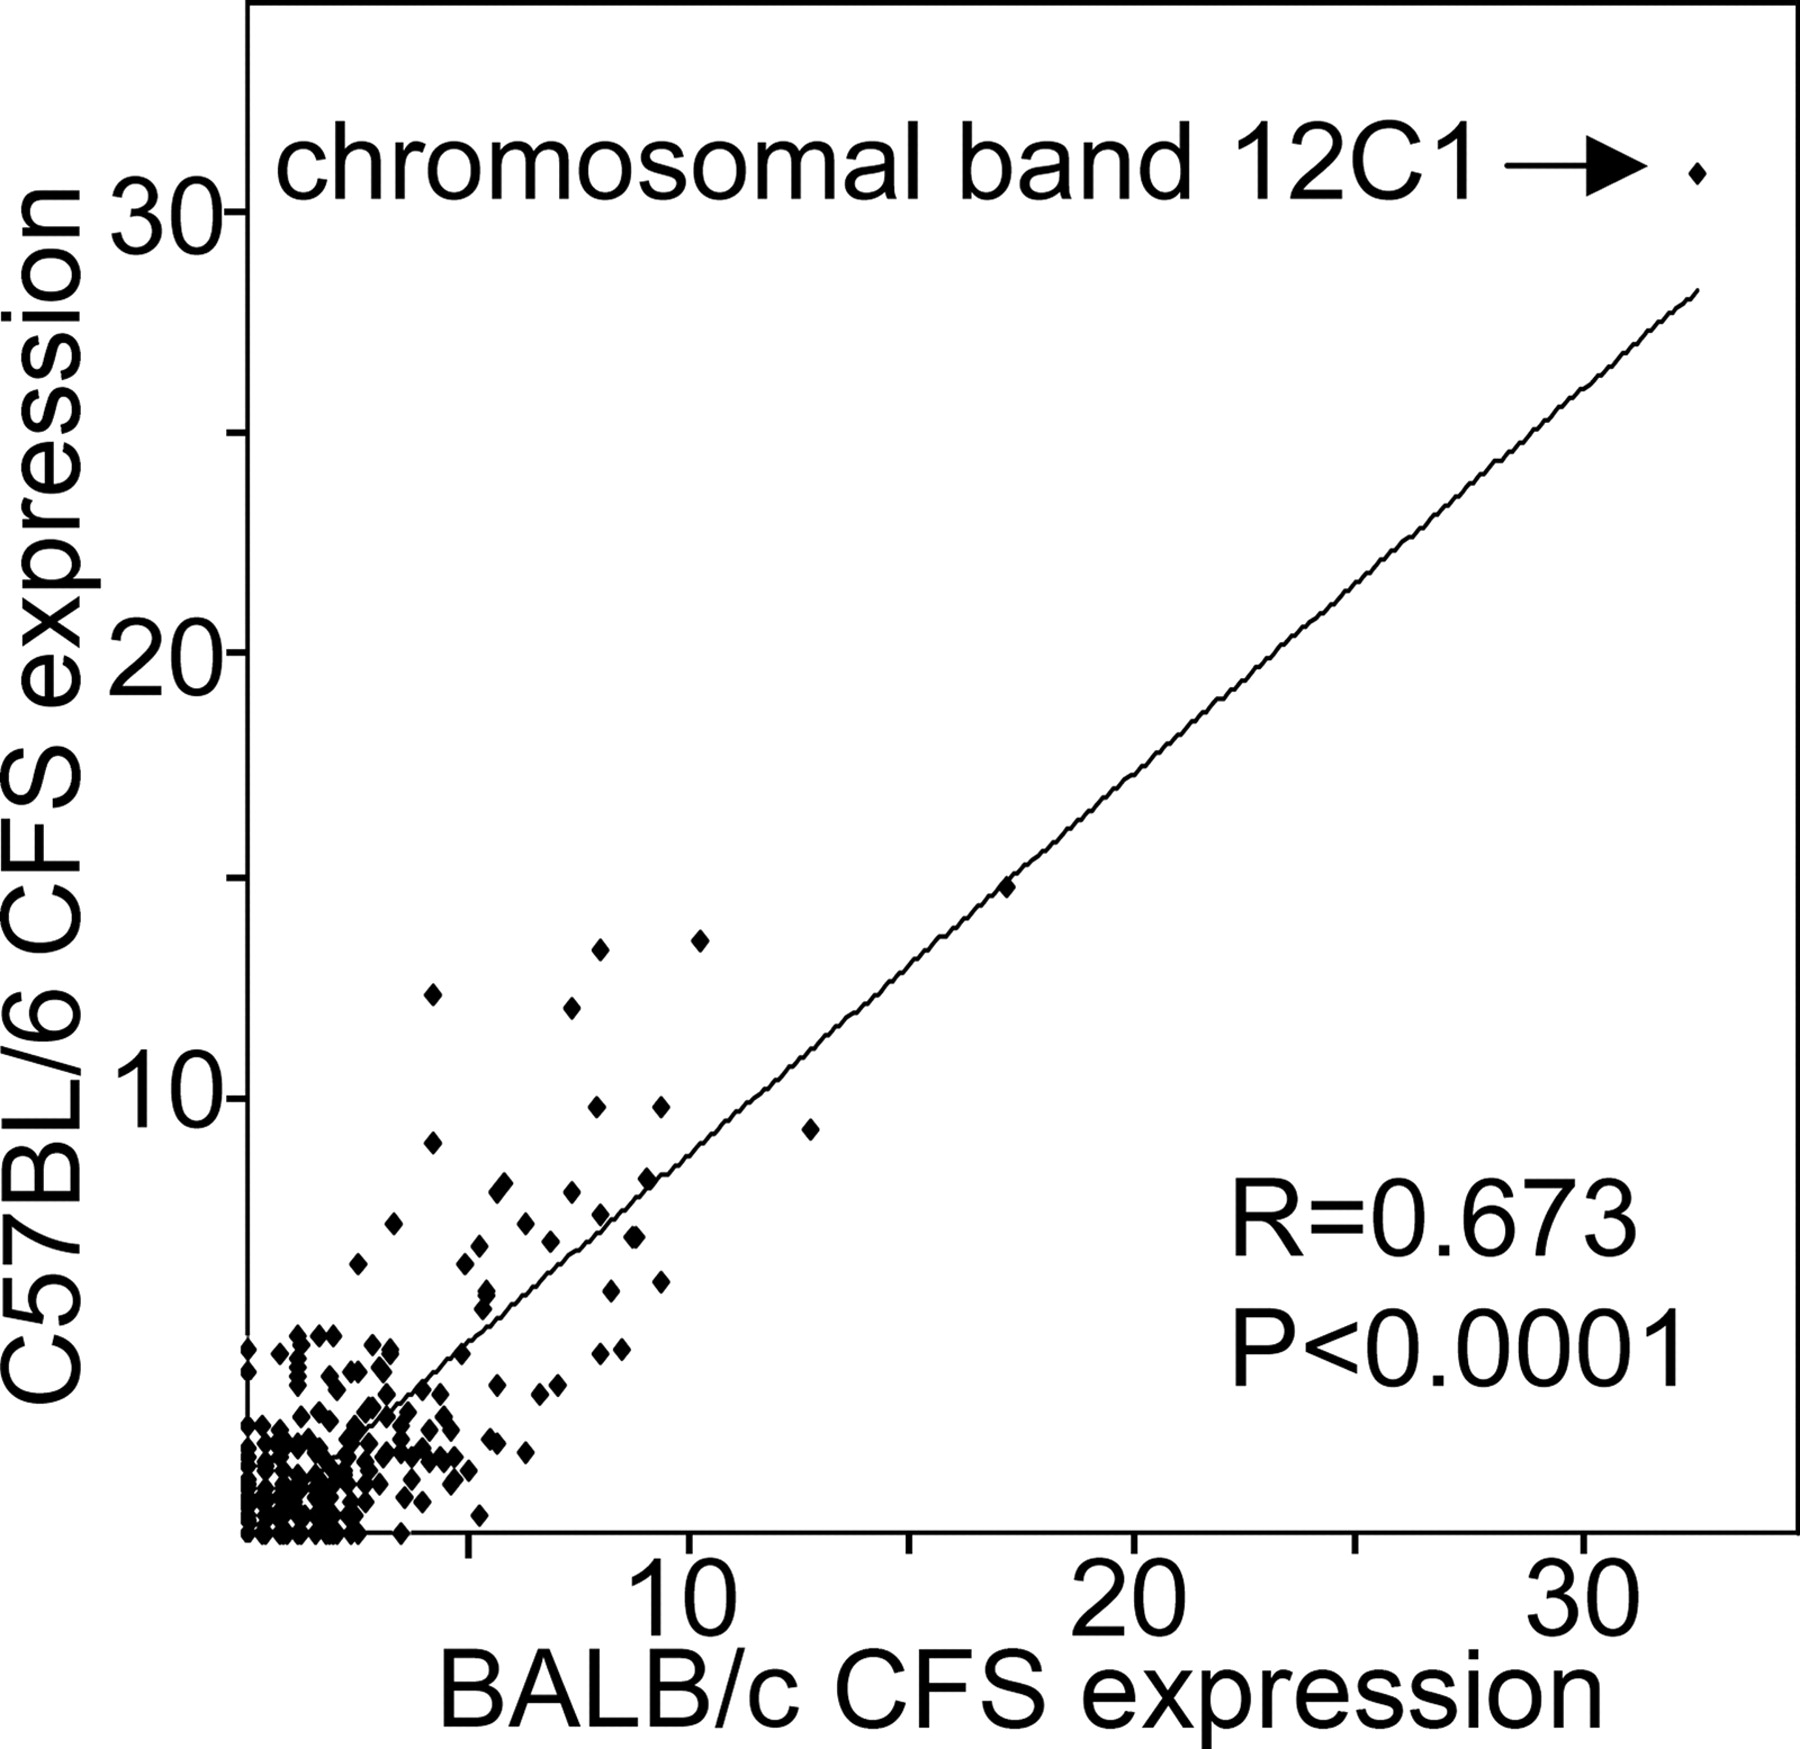
Figure 3.
Relation of CFS expression levels (including G and DB at0.4 μM APC, shown as percent of analyzed chromosomes) in 392 cyto- genetic bands of BALB/c and C57BL/6 mice. The line of best fit is shown. R is the Spearman test correlation coefficient. CFS expression on the chromosome band level is conserved in the two mouse strains.


