
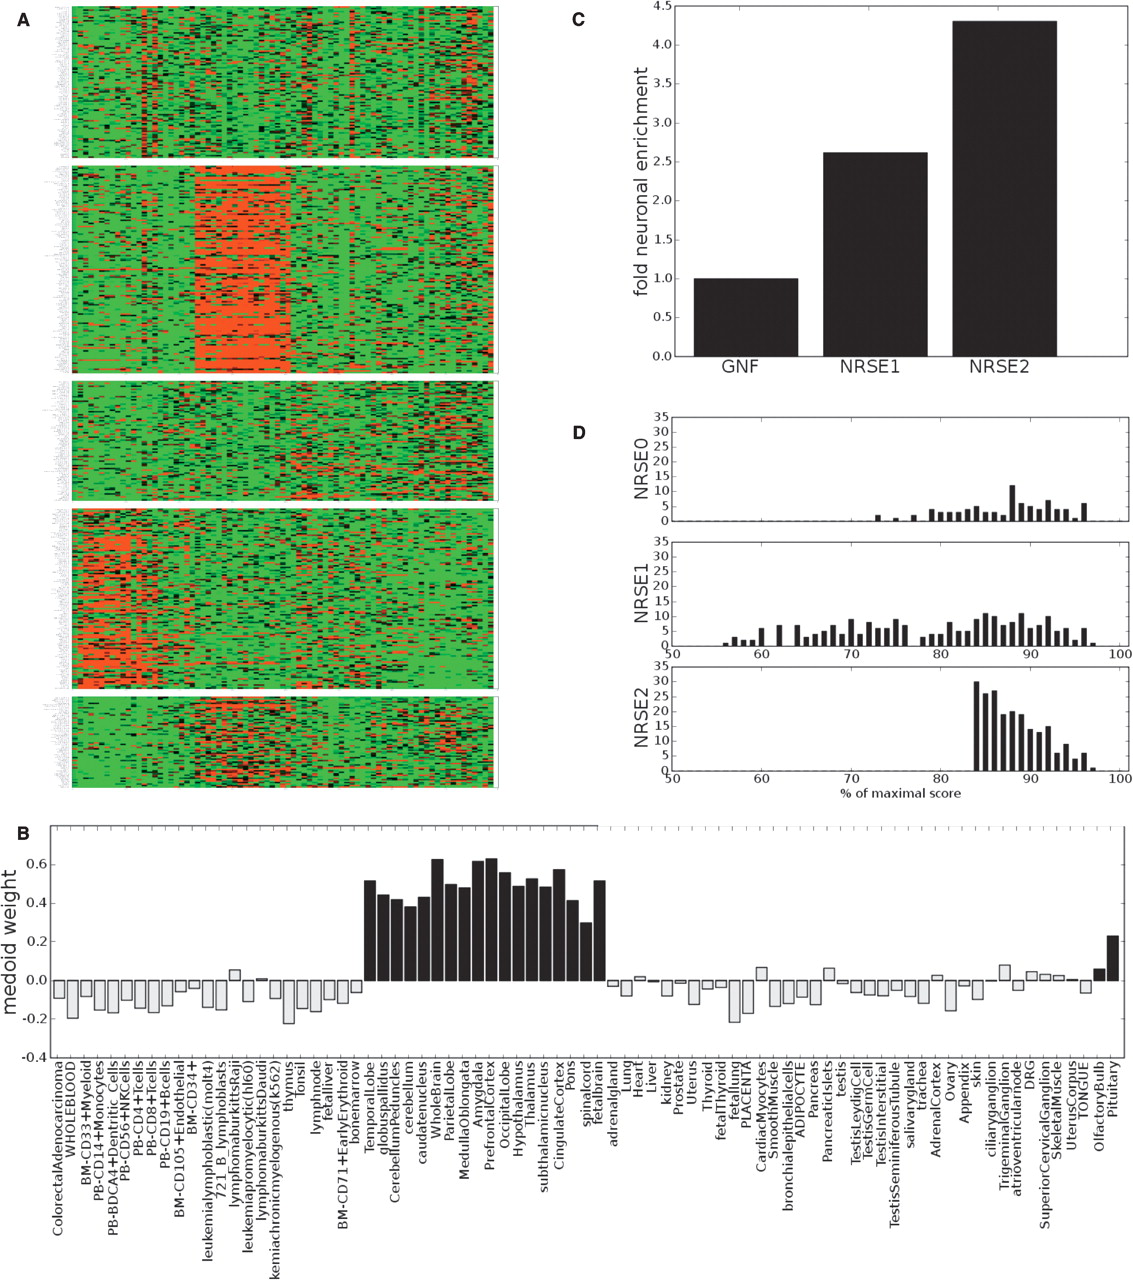
Tissue expression pattern of NRSE associated-genes shows brain-specific expression enrichment. (A) Human genes with an NRSE2 (listed in Supplemental Table S2) with an expression pattern in the GNF survey of 79 human tissues, were clustered using the k-medians algorithm as described in the Methods. The second and fifth clusters, which encompass 40% of the NRSE2-associated genes show a clear, brain-specific expression pattern. (B) Weights of the k-medoid for cluster 2, with brain tissues highlighted in black. Note that cardiac myocytes and pancreatic islet cells also have positive weights. (C) NRSE2 shows a 3.5-fold enrichment of “brain specific” genes (as defined by the medoid in B) compared with the GNF data sets, and shows greater enrichment than NRSE1. (D) NRSE0 (top), NRSE1, and NRSE2 matches associated with genes than have a greater than 0.4 correlation with the medoid vector in B. NRSE1 shows a double-humped distribution of matches, with matches weaker than 77% accounting for half of its matches; these low scoring matches are likely false-positives.


