
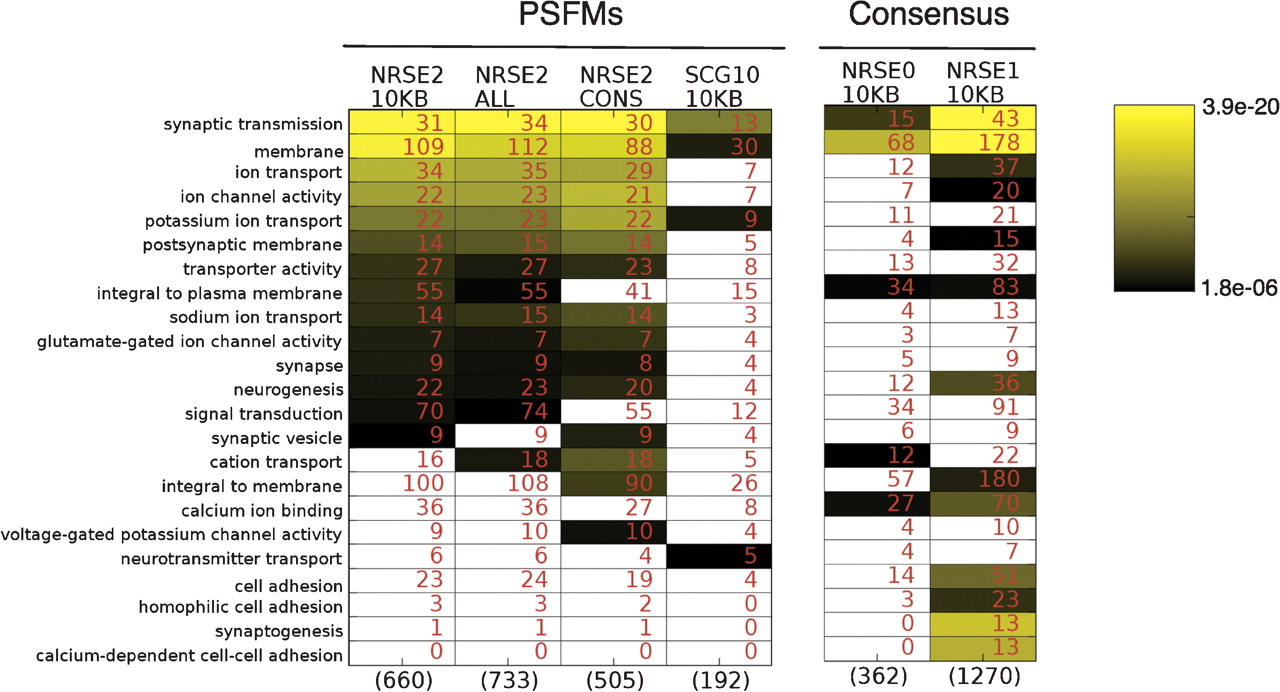
Gene Ontology enrichment comparison of different NRSE cis-regulatory cohorts. Cohorts of human genes within 10 kb of a candidate NRSE0 (Schoenherr et al. 1996), NRSE1 (Bruce et al. 2004), SCG10 (the original seed motif), NRSE2, All NRSE2 matches, and conserved NRSE2 matches were filtered of repeat matches and were analyzed for GO term overrepresentation. Significantly enriched GO terms in at least one of the cohorts (of 4576 possible GO terms) are shown. Numbers in cells represent the genes with the term in the cohort, while numbers in parentheses represent the cohort size. Cells shown in color pass the threshold of significance, as determined by a Bonferroni correction. GO terms are sorted in decreasing order by P-values of the leftmost column. Note that GO enrichments are in terms of decrease in P-values, which are directly correlated to the size of the cohorts; the number of genes in the shared association cohort with a particular GO term may go down or stay the same, while its significance increases. The NRSE1 motif behaves differently from the other definitions, as seen in the enrichment of synaptogenesis, which is the result of weak matches within the paralogous protocadherin β family.


