
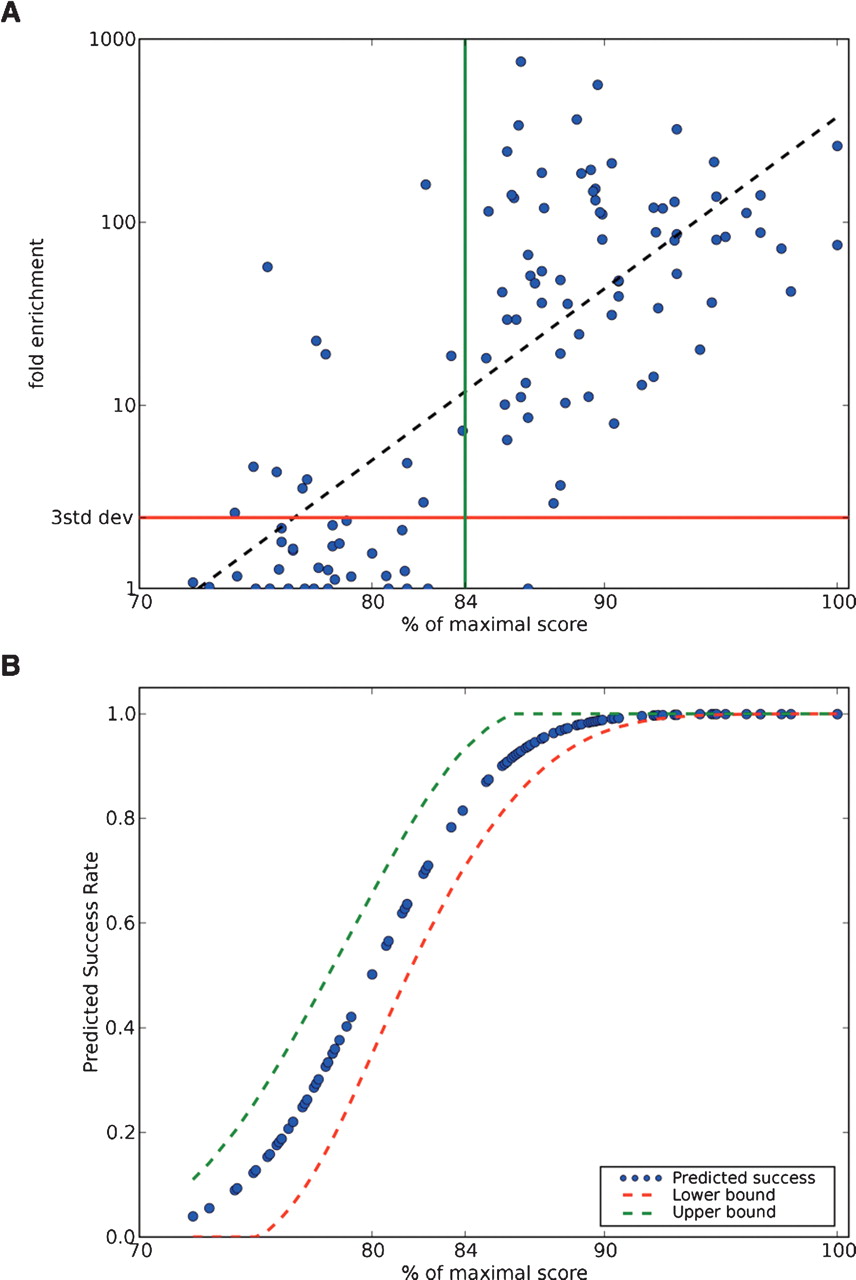
Quantitative analysis of chromatin immunoprecipitation of NRSF. (A) A total of 113 potential NRSE2 matches, 42 of which fell below our threshold of 84% (green vertical line), were assayed using ChIP followed by quantitative PCR. Fold enrichments were calculated by dividing the absolute number of genomic equivalents of each NRSE by the mean of the recovered amounts of five random nongenic, nonconserved regions. Fold enrichments that were above three standard deviations from the mean of the five random nongenic amounts (red line, 2.44 × enrichment), were considered to be occupied sites. An exponential regression (black line in this semilog plot), which would correspond to the regression in Figure 2B, accounts for about half of the data's variation (R2 = 0.56). A total of 13 of the 83 occupied sites (16%) fell below our 84% threshold. (B) Cumulative normal distribution function of probit coefficient vs. score with 95% confidence levels shown by dashes. The estimated chance of a success match goes up by nearly half between 80% and 84%.


