
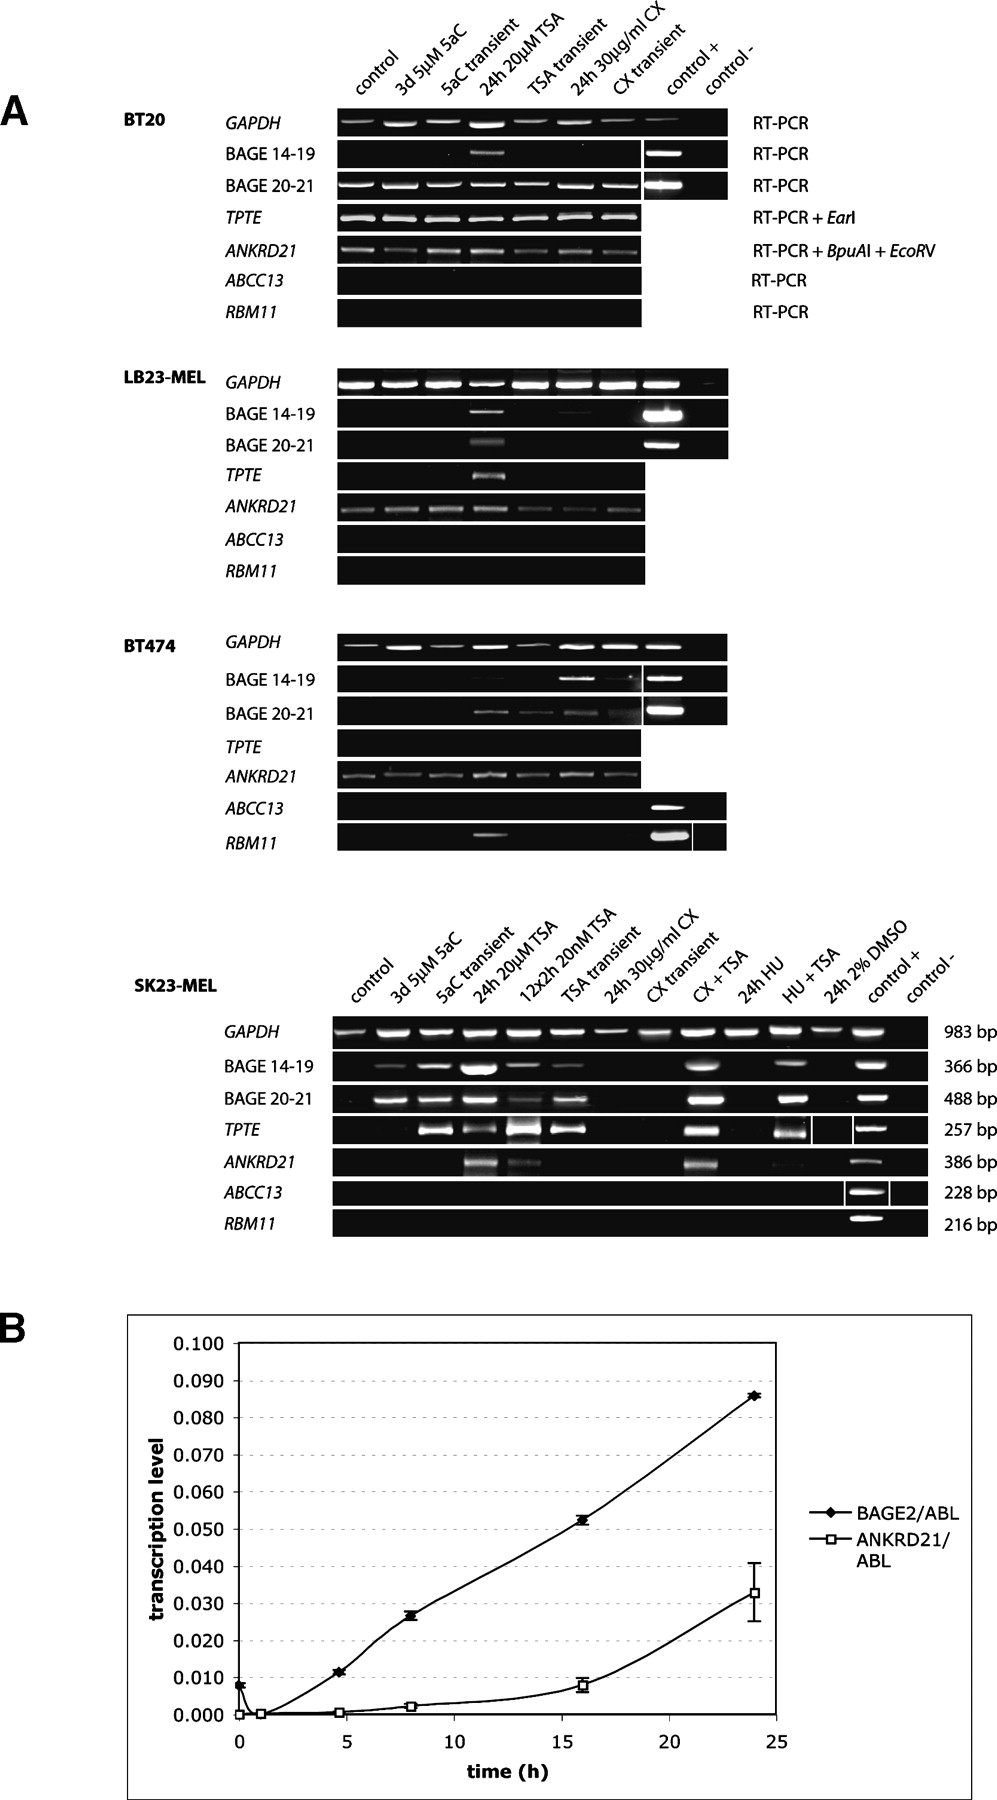
Figure 4.
(A) Bands of RT-PCR products in agarose gels after electrophoresis and staining with ethidium bromide. Four different cell lines were incubated with the drugs indicated above each panel. A testis cDNA library served as positive control. Genes are indicated on the left side. On the right side of the upper panel are enzymes that were used to identify loci on chromosome 21; on the right side of the lower panel is the size of PCR products. (B) Kinetics of gene induction by TSA: The x-axis is the duration of treatment with 20 μM TSA in hours; y-axis is relative transcription strength determined by quantitative RT-PCR (ng RNA target/ng RNA ABL1).


