
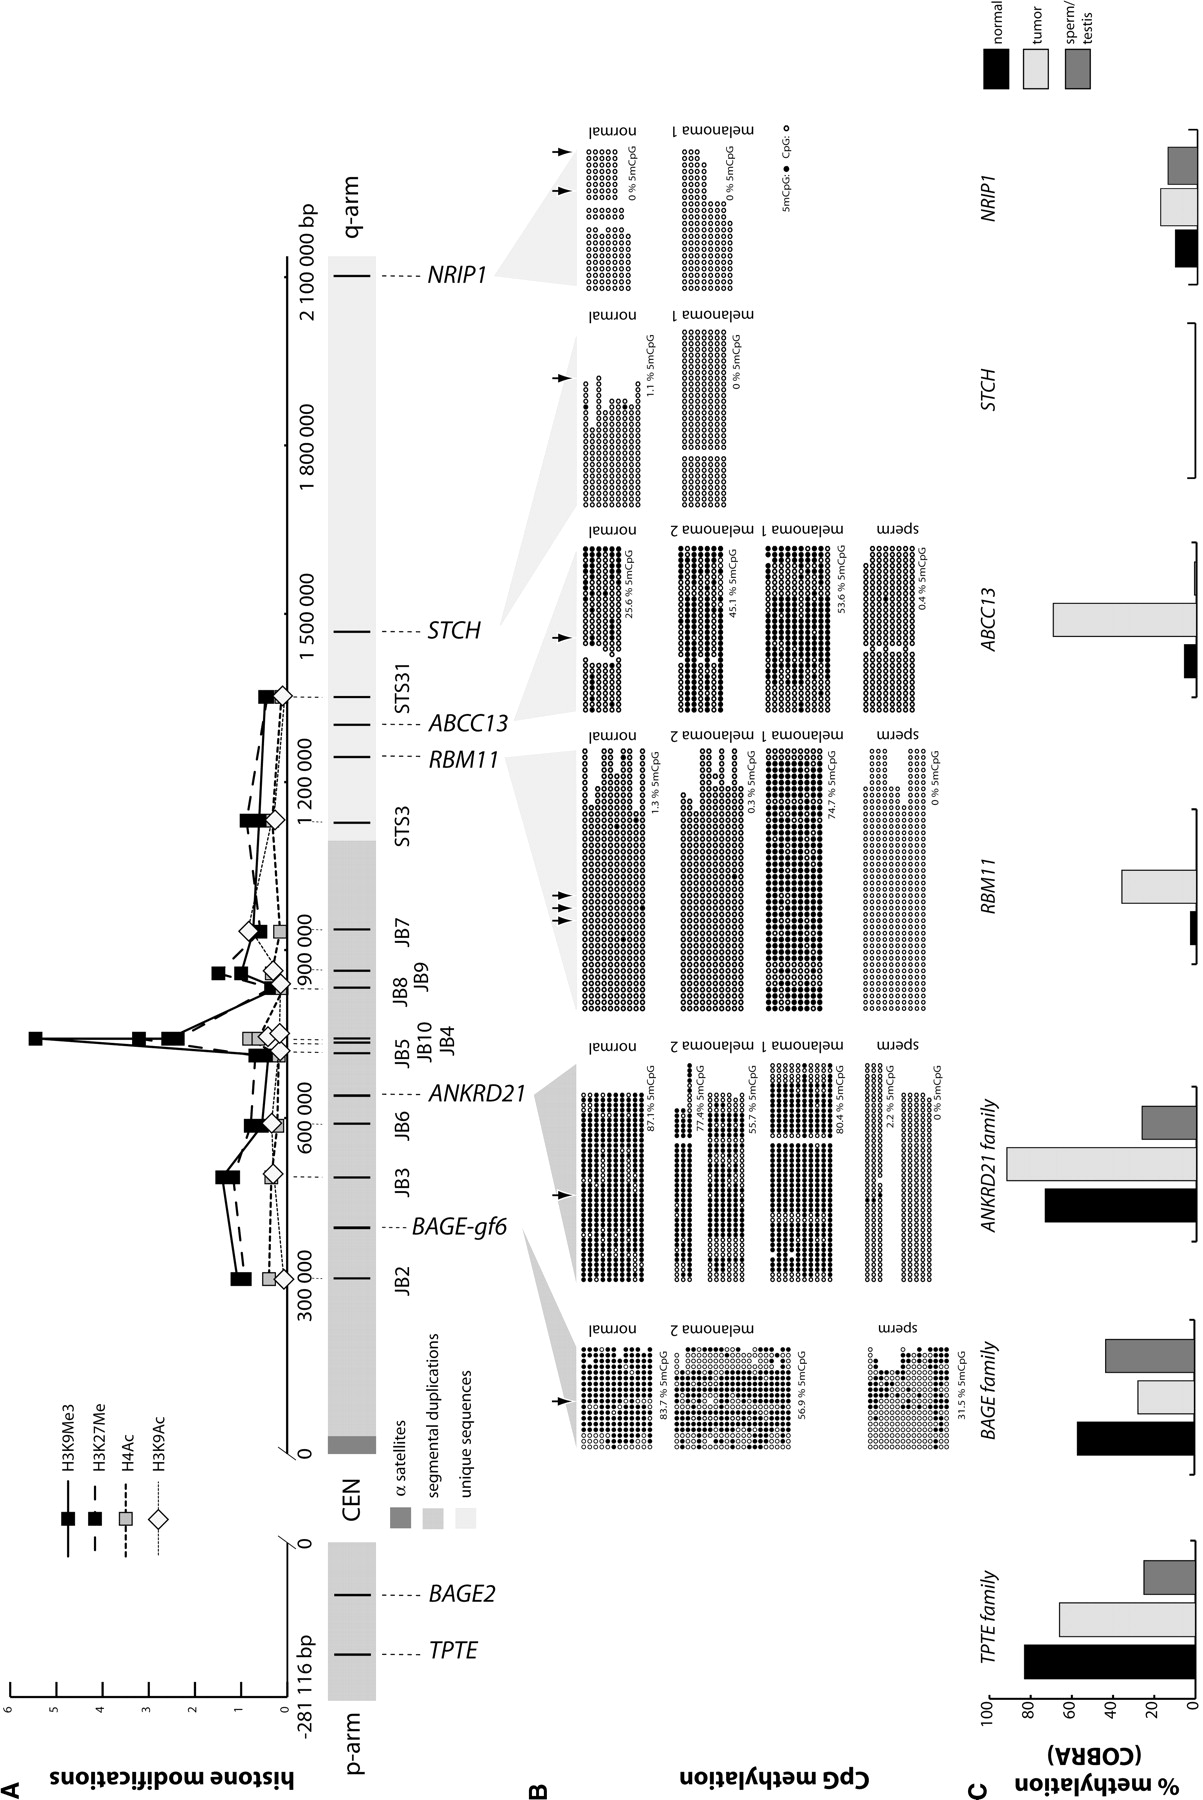
Schematic representation of DNA methylation and histone modification status in the juxtacentromeric region of human chromosome 21. (A) The x-axis is as in Figure 1; the y-axis shows relative enrichment of histone isoforms compared to GAPDH. STSs and genes are represented along the x-axis. Error bars are omitted for sake of clarity; standard errors are in Supplemental Table IV. (B) CpG methylation is given for BAGE-gf6, ANKRD21, RBM11, ABCC13, STCH, and NRIP1, with 5mCpG as filled circles and unmethylated CpG as hollow circles for normal somatic tissue (skin 1), sperm (sperm 1), melanoma cell lines melanoma 1 (SK23-MEL), and melanoma 2 (LB1622-MEL). Average methylation of CpG pairs is given under each sequence stack. Arrowheads indicate positions of restriction sites used in COBRA. ANKRD21 exists in two alleles, and for heterozygous samples melanoma 2 and sperm, methylation in each allele is indicated. (C) Average methylation (%5mCpG) in three tissue groups determined by COBRA and corrected for PCR bias. For TPTE, BAGE, and ANKRD21 the average methylation in the corresponding gene families is shown since PCR primers used for COBRA do not distinguish between paralogous loci.


