
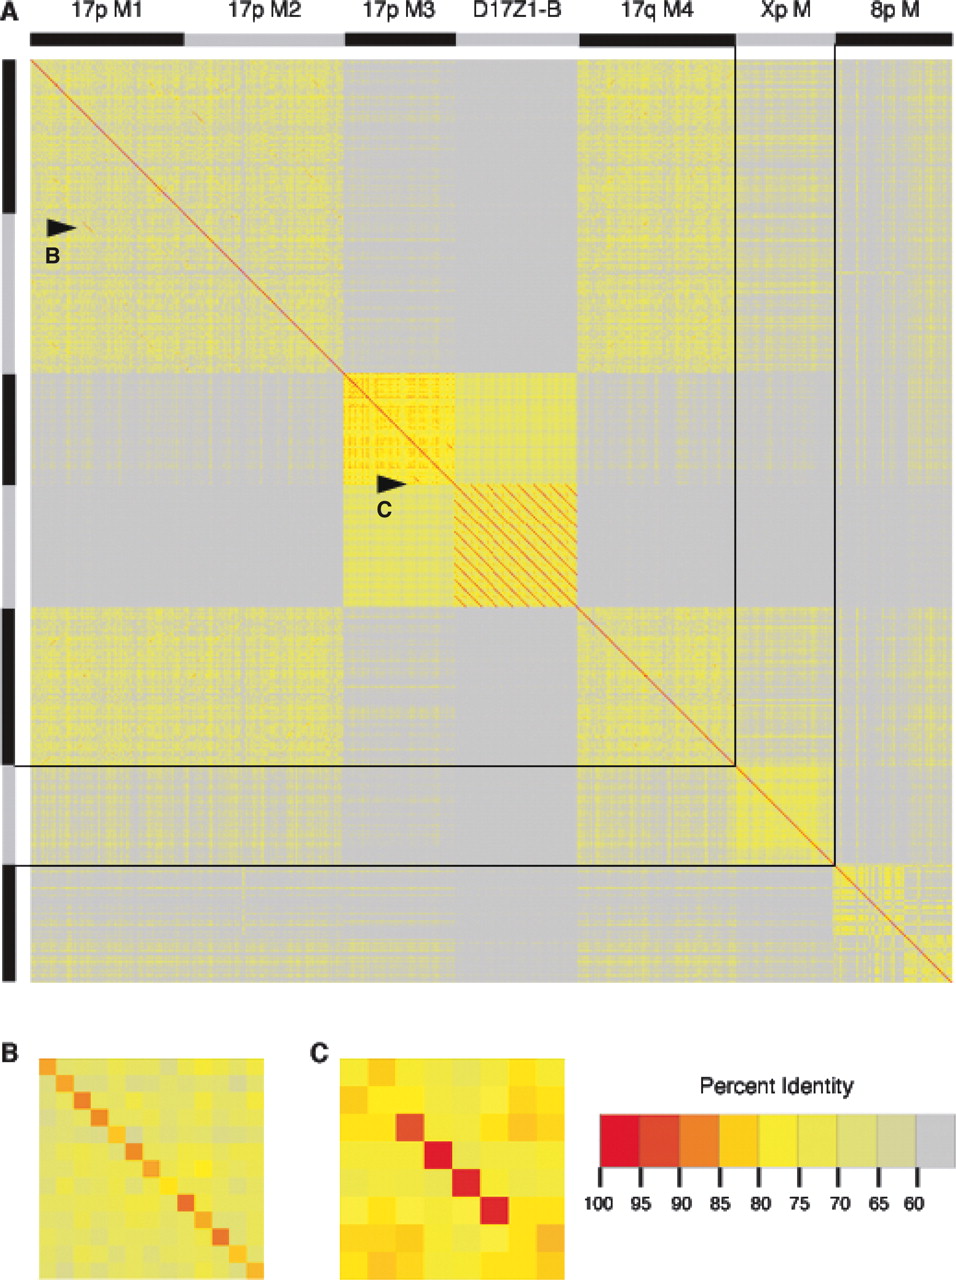
Figure 2.
Percent identity scores for pairwise comparisons of α-satellite monomers. All pairwise comparisons were calculated for α-satellite monomers and percent identity scores were depicted according to the color scale. The chromosomal origin of α-satellite monomers is shown at the top of the figure in alternating black and gray bars. (A) Pairwise comparisons for monomers from the assemblies of chromosomes 8 and 17 and the X chromosome. Black lines indicate the boundaries of monomers from each chromosome. (B,C) Detailed versions of percent identity scores from regions indicated by arrowheads.


