
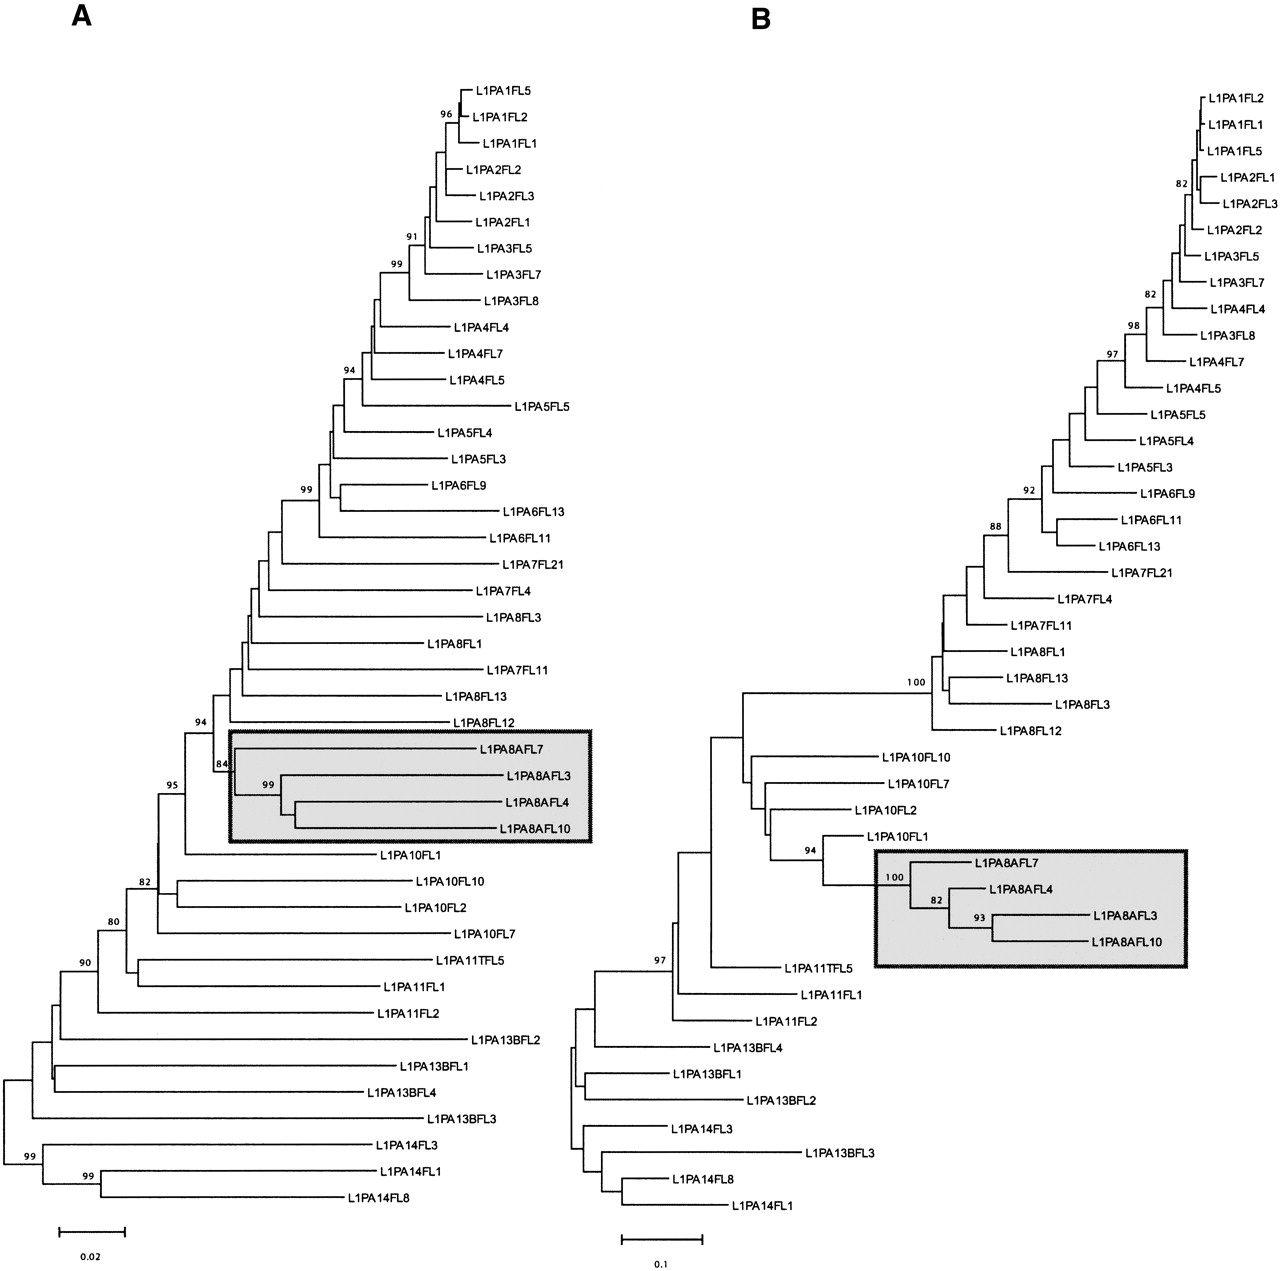
Figure 4.
Phylogeny of L1 genomic sequences. These trees were built using the neighbor-joining method based on Kimura's two-parameter distances. These two trees were built using the same full-length elements but using different regions of L1. Tree A was built using the 3′ end of the elements (2000 bp) and tree B was built using the 5′ end of the elements (300 bp). Only bootstrap values > 80 are shown. The gray boxes indicate that the L1PA8A family is forming a distinct lineage (see text).


