
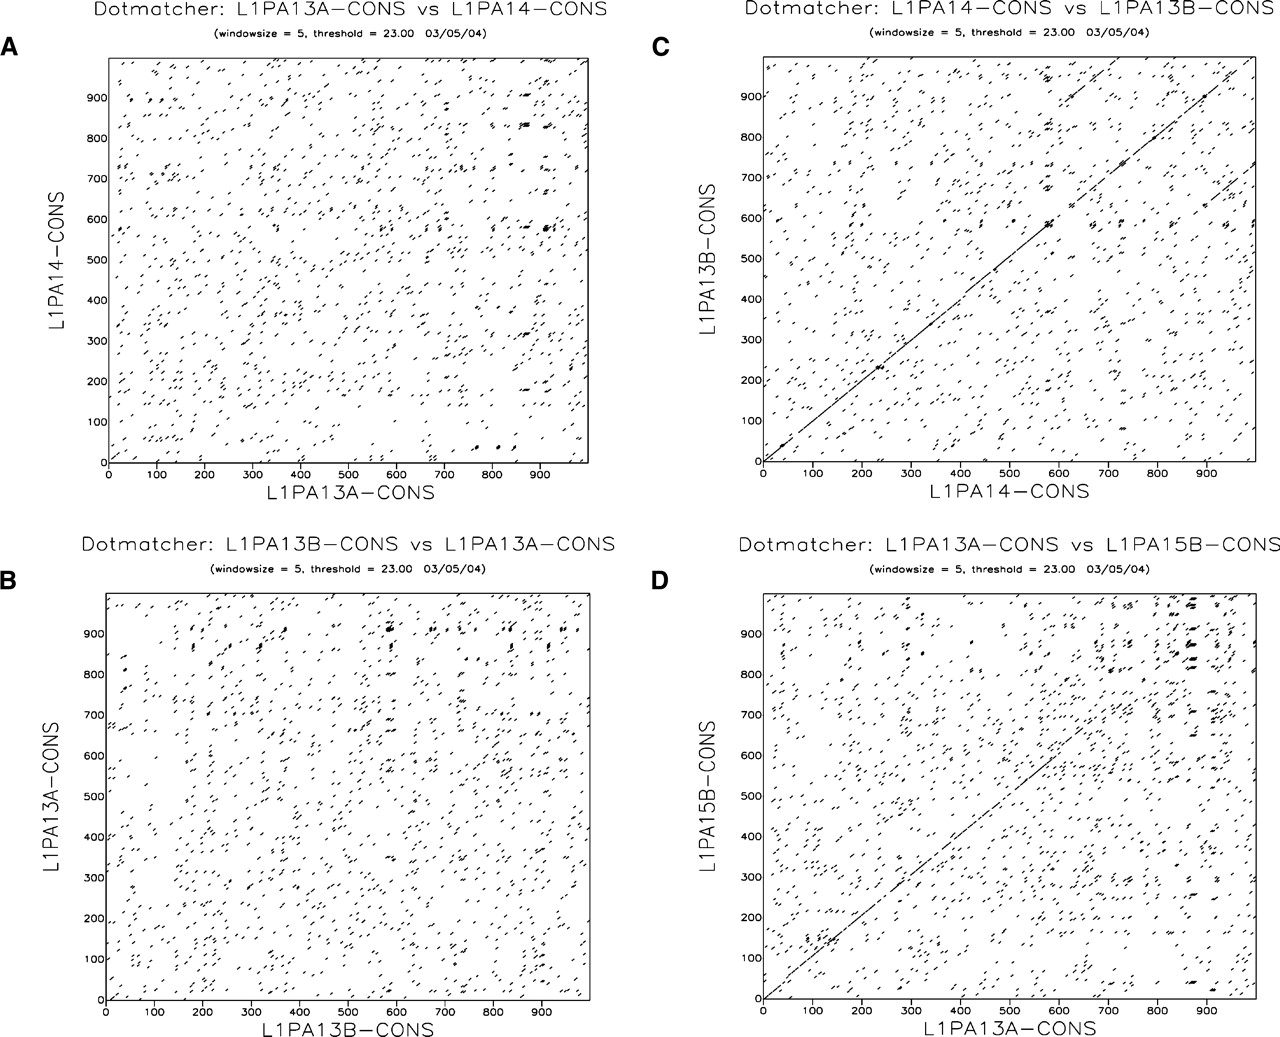
Figure 3.
L1 families of similar ages have unrelated 5′UTR sequences. This dot plot analysis, based on the first 1000 bp of the 5′UTR, shows that the 5′UTR of family L1PA13A is unrelated to the 5′UTR of families L1PA14 (A) and L1PA13B (B). In contrast, families L1PA14 and L1PA13B (C) and families L1PA13A and L1PA15 (D) are relatively similar.


