
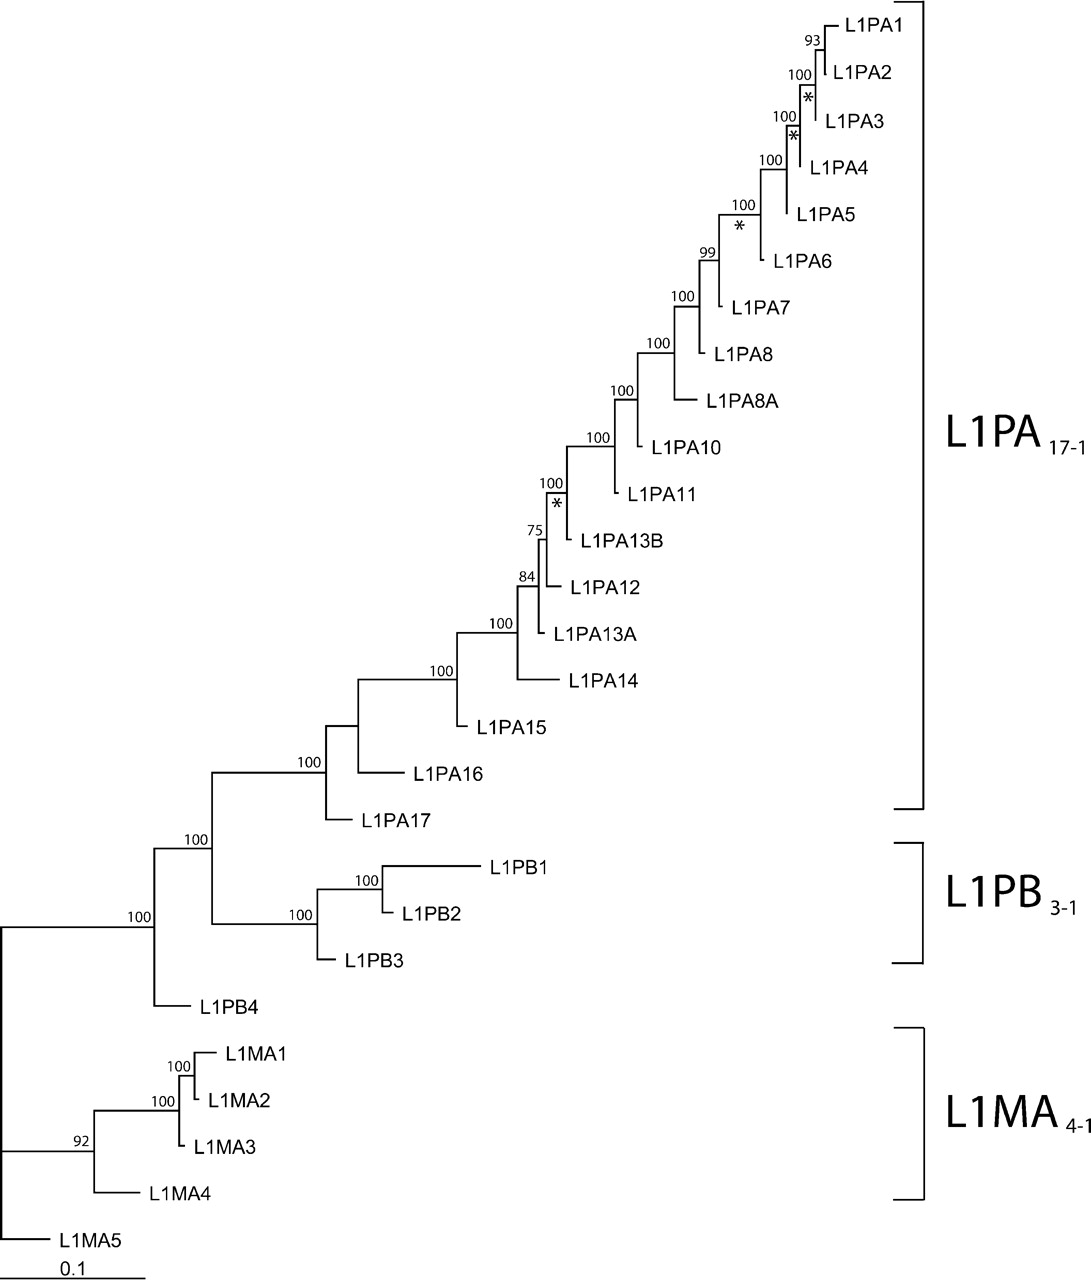
Figure 2.
Phylogeny of L1 consensus sequences. This maximum likelihood tree is based on the consensus sequences of the ORF1 and ORF2 of 27 L1 families. The numbers above the nodes indicate the percentages of time the labeled node was present in 1000 bootstrap replicates of the data. Asterisks indicate branches on which the free-ratio model assigned estimates of ω > 1.


