
Figure 1.
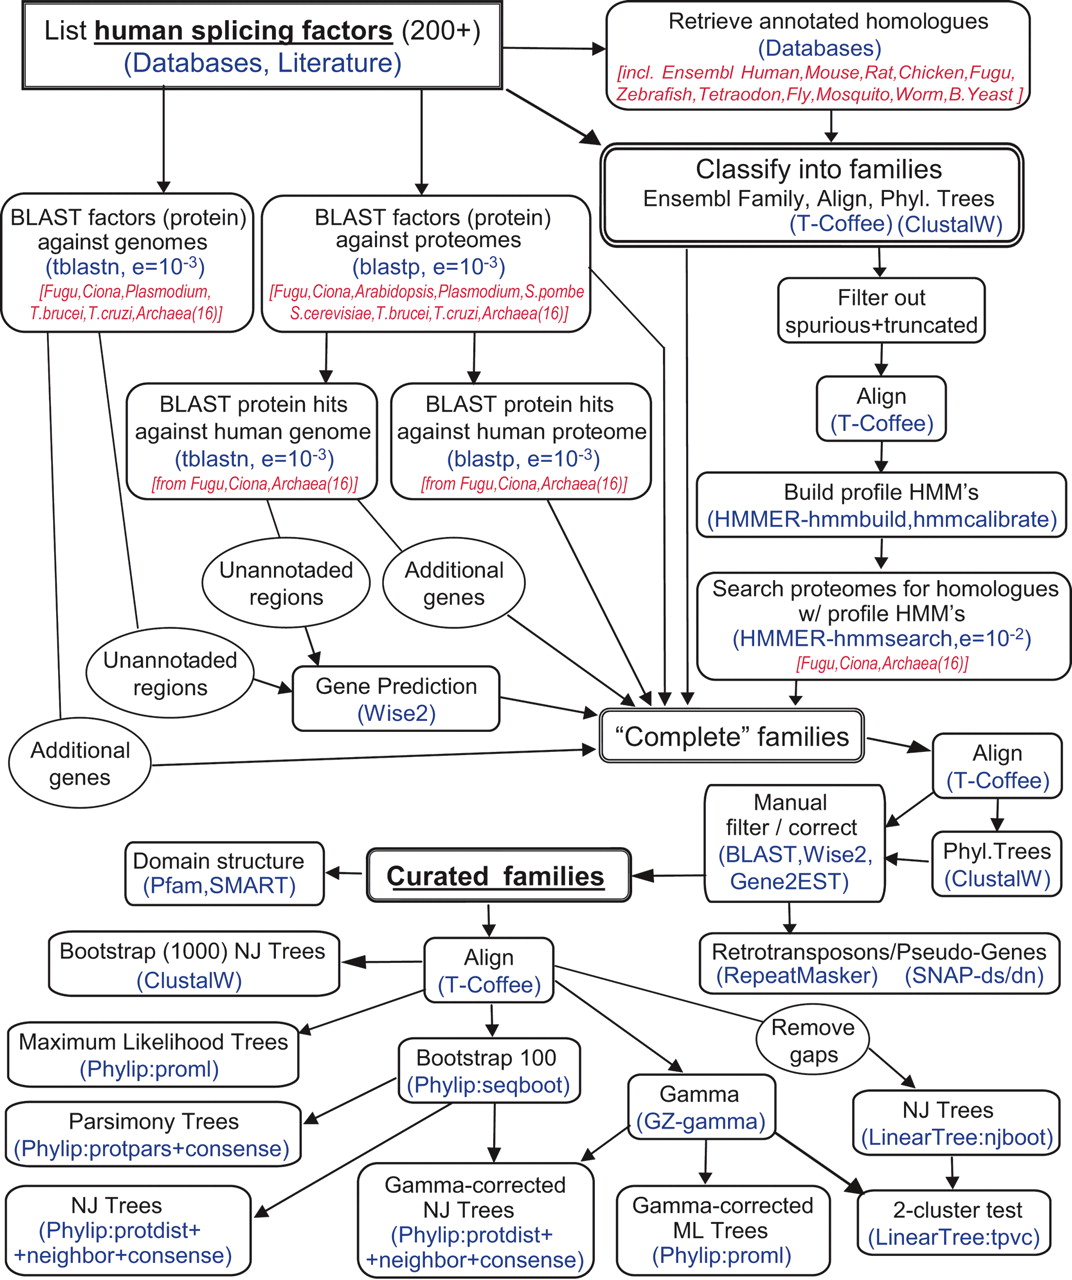
Schematics of the computational pipeline flow. Sources, software, and parameters are represented in blue and species in red.
(Downloading may take up to 30 seconds. If the slide opens in your browser, select File -> Save As to save it.)
Click on image to view larger version.
Schematics of the computational pipeline flow. Sources, software, and parameters are represented in blue and species in red.
 CiteULike
 Delicious
 Digg
Digg Facebook
 Google+
 Reddit
 Twitter
