
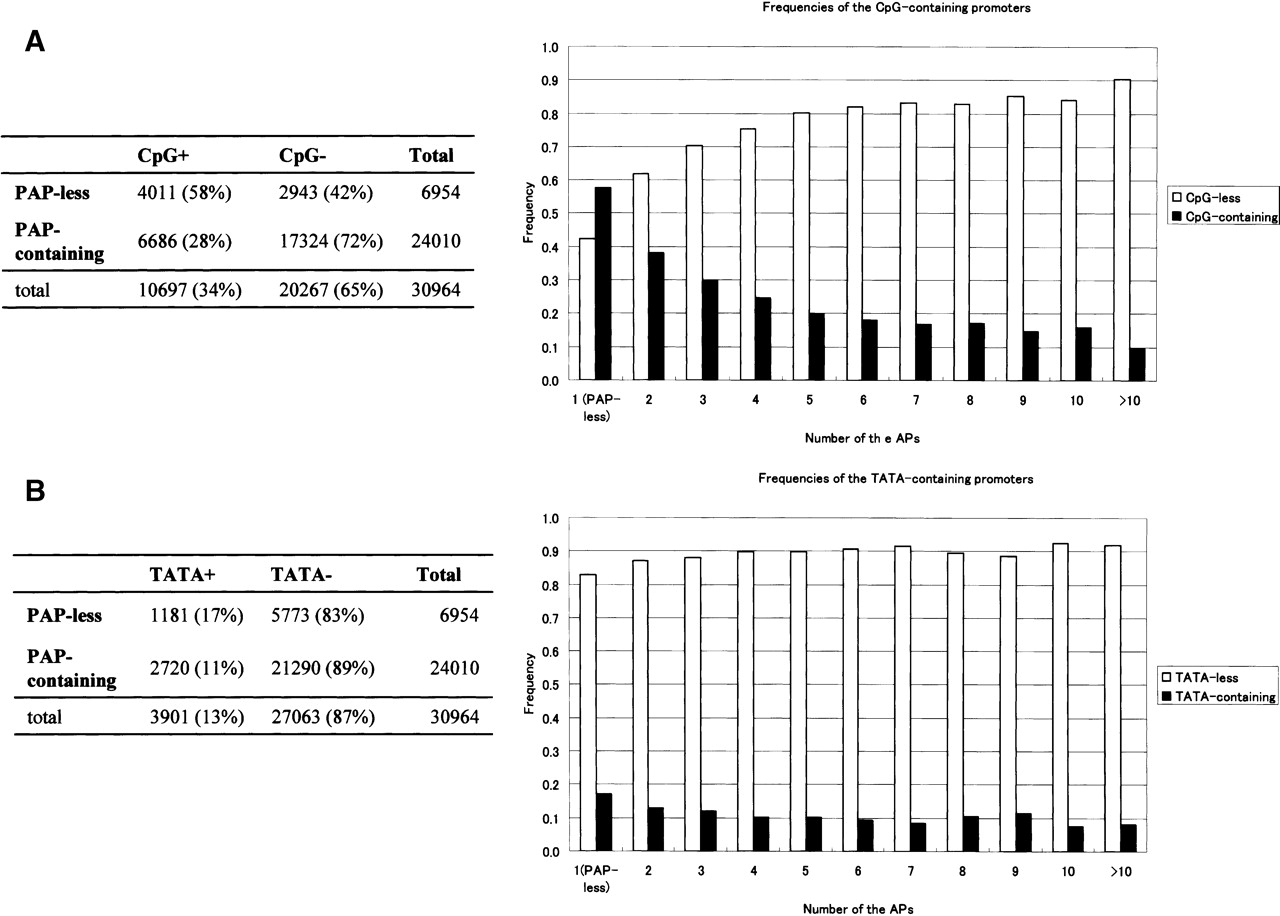
Figure 3.
Relationship between the PAPs and the CpG islands and TATA boxes. Frequencies of the CpG island (A) and TATA box (B) containing PPRs. In the right panels, the relationship between the number of PAPs (x-axis) and the frequency of the corresponding promoter motif (y-axis) is shown.


