
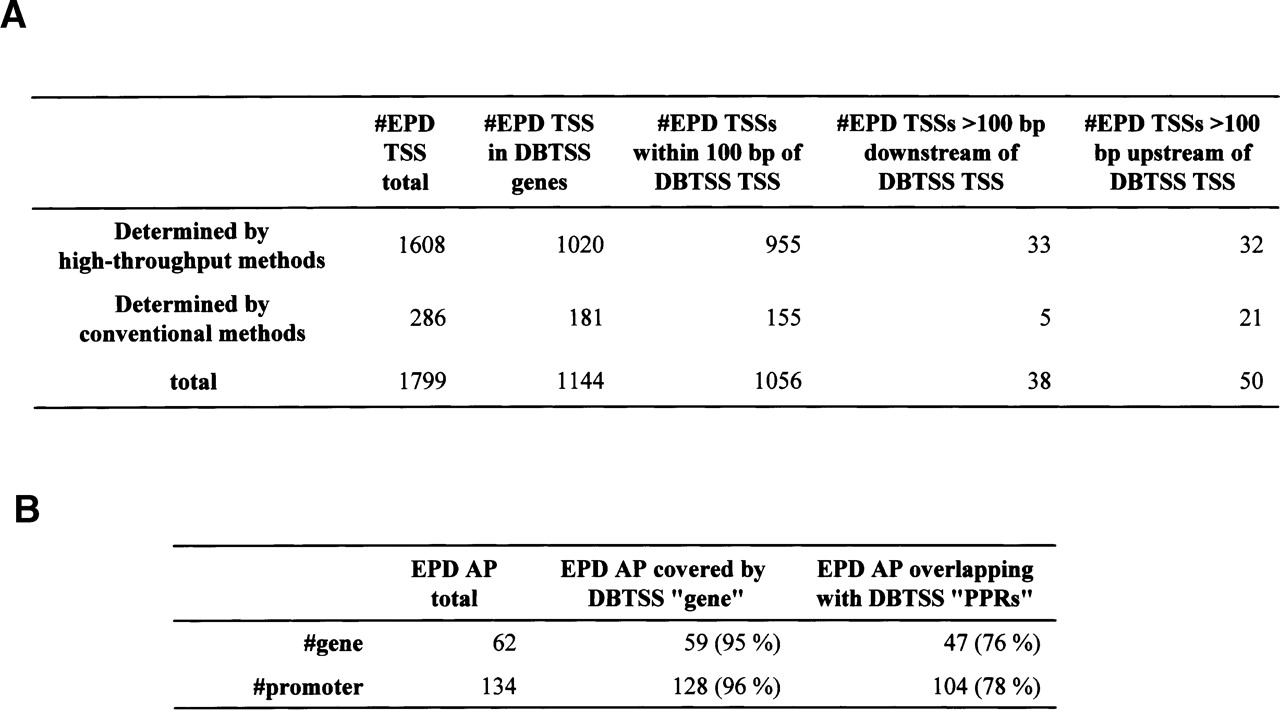
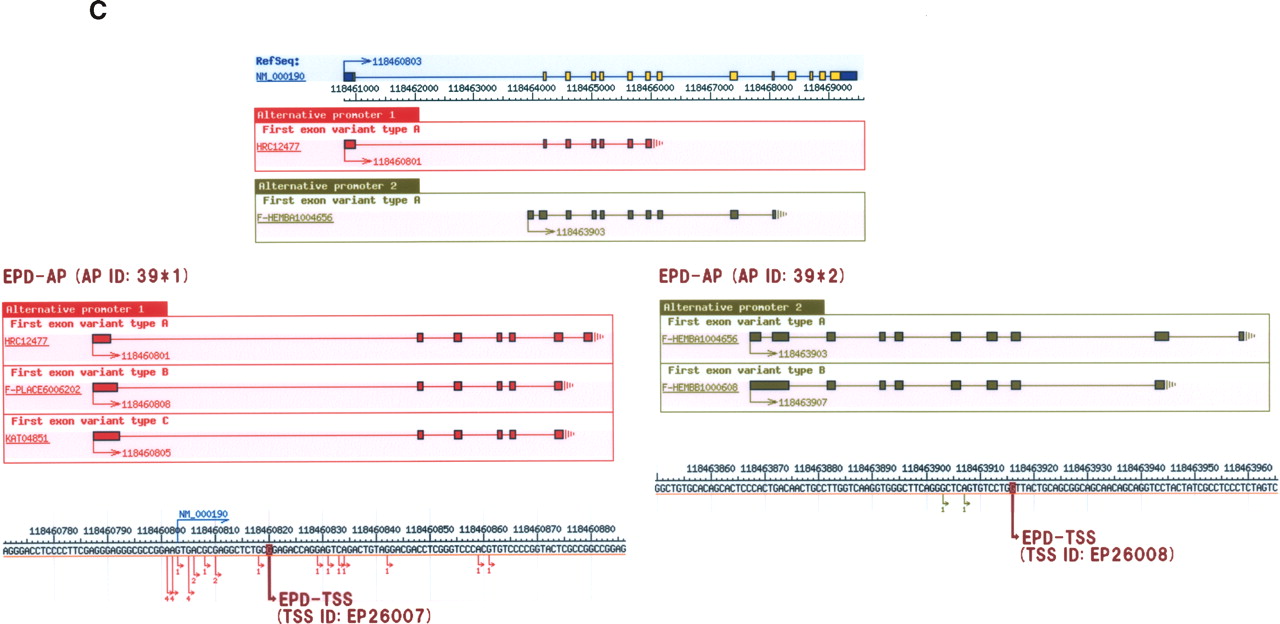
Comparison of the DBTSS data with the previously characterized TSSs and APs. TSSs (A) and APs (B) identified by the DBTSS data were compared with those characterized in previous studies. When a TSS/AP registered in EPD was located within 100 bp of one in DBTSS, they were counted as “overlapping.” The margin of 100 bp was allowed considering fluctuations of the TSSs (Suzuki et al. 2001a). (A) The “overlapping” was counted separately for the TSS data obtained from high-throughput cDNA cloning methods (like ours) and that from conventional methods, such as RACE and nuclease protection assays. Note that as some of the TSSs were identified by multiple methods, the total numbers in the third line are not always the sum of the above two. (B) First column is the total number of EPD genes registered as “alternative promoter-containing genes” and the number of the corresponding promoters; second column is the coverage of the DBTSS against EPD at the gene level; third column is coverage of the DBTSS against EPD at the promoter level (all APs were covered by DBTSS PPRs). (C) The case in which EPD data and DBTSS data were overlapping with each other is exemplified by the case of the human hydroxymethylbilane synthase gene (NM_000190). RefSeq exons are shown in blue (non-coding regions) and yellow (coding regions) boxes and the DBTSS exons are shown in red (PAP group 1) and green (PAP group 2) boxes. The lower panels are magnifications of the upper panel(s). The TSSs are represented by arrows of the corresponding colors. The IDs of corresponding EPD data are shown. Note that there are variations in the first exon patterns even within the same PAP group (alternative donor in PAP1 and retaining intron in PAP2) and the TSSs are fluctuating. For additional examples, see Supplemental Table 3.


