
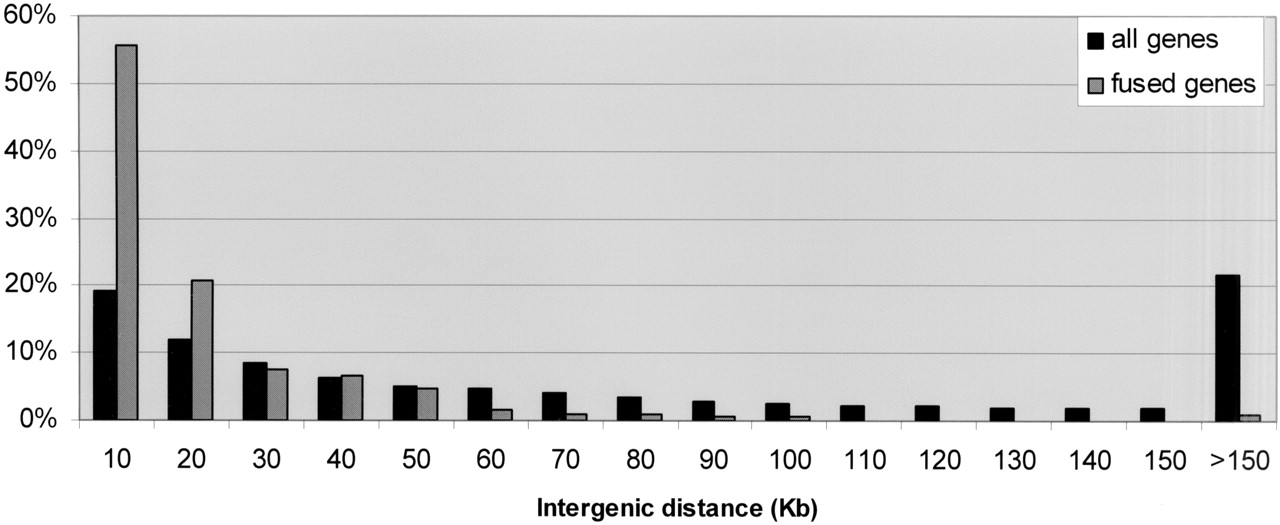
Figure 3.
Intergenic distances distribution. Compared are a data set of “all genes,” representing distances between 12,395 consecutive RefSeq pairs residing on the same strand in the human genome, and “fused genes,” representing distances between the 212 genes in the current analysis. x-axis, intergenic distance in kilobase, divided to bins of 10 kb (i.e., the “20” bin corresponds to distances between 10,001 and 20,000 bp). y-axis, percent of gene pairs out of each data set. Notably, fused genes tend to reside much closer on the genome than the entire population of gene pairs.


