
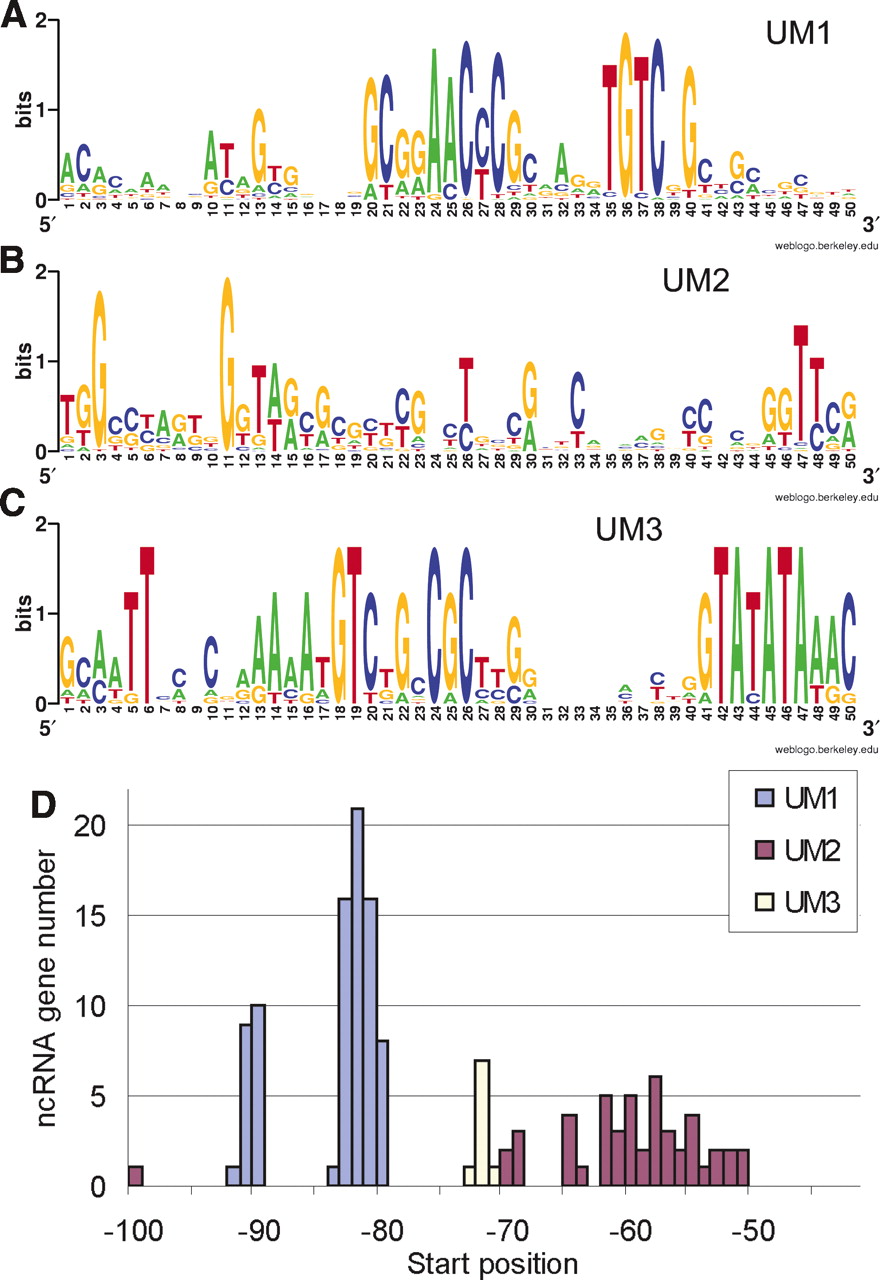
Upstream motifs discovered at ncRNA loci. (A) Upstream motif 1 (UM1; E = 4.0 × 10–521). (B) Upstream motif 2 (UM2; E = 7.3 × 10–179). (C) Upstream motif 3 (UM3; E = 1.1 × 10–38). (For explanation of E, see Fig. 2.) (D) Distribution of distances from motif position 1 of UM1, UM2, and UM3, respectively, to 5′-end of the ncRNA transcripts. UM1 and UM3 have defined distances from start of the motif to the 5′-end of transcript. The two peaks for UM1 represent distances for loci with (smaller peak) and without (larger peak) an additional TATA-box. The distances between UM2 and transcript 5′-ends are more variable, possibly indicative of post-transcriptional 5′-end processing for this group of ncRNAs.


