
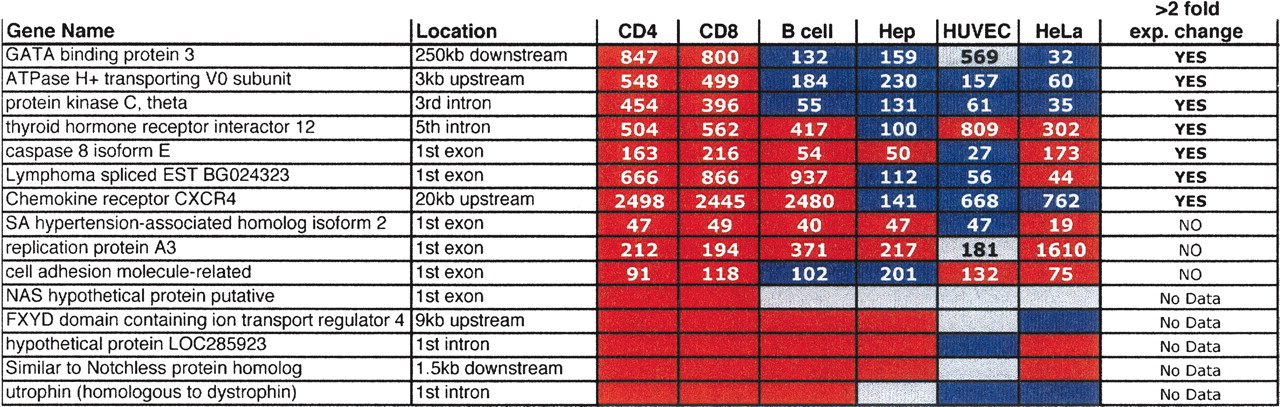
Comparisons of DNase clusters that vary in hypersensitivity in different cell types
Click on table to view larger version.
-
The location of each DNase cluster relative to the nearest gene is displayed. Red boxes identify regions that are hypersensitive (Δ Ct > 2) and are not statistical outliers. Blue boxes identify regions that are not hypersensitive (Δ Ct > 2) and are statistical outliers. Gray boxes identify regions that are hypersensitive (Δ Ct > 2), but are statistical outliers. The relative expression values of each gene, as determined by Affymetrix U133A expression arrays, are displayed within each box (Su et al. 2002). Genes that display a greater than twofold decrease in gene expression, when a DNase HS site is not present in non-T cells, are indicated at the right. “No Data” represent genes that were not analyzed on the Affymetrix U133A microarra.


