
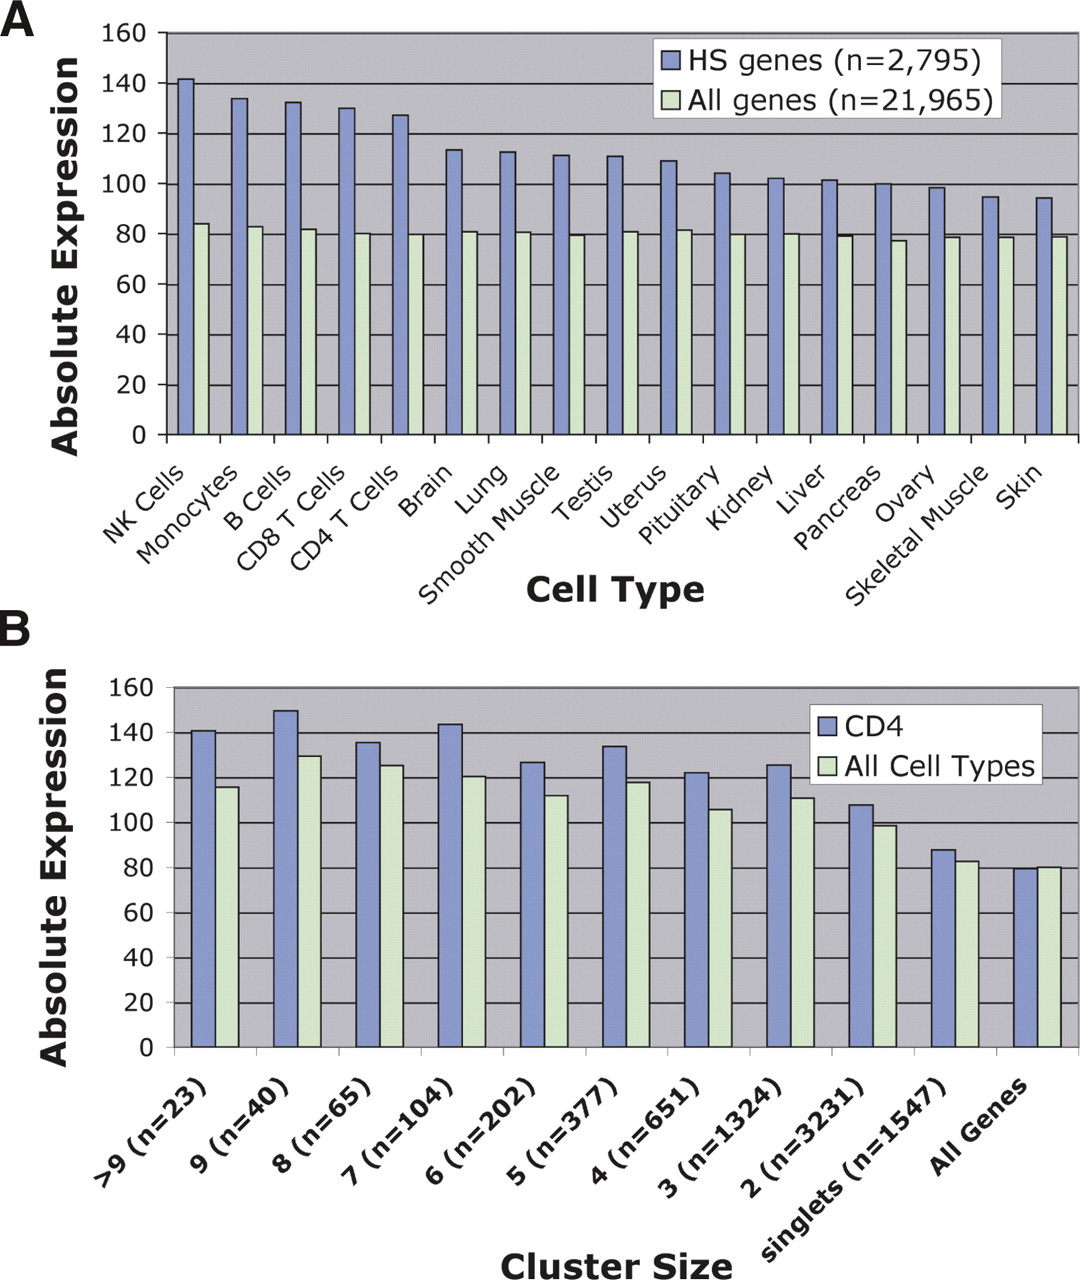
DNase HS sites identify genes that have higher levels of expression using microarray analyses. (A) Average expression values of genes that had a DNase HS site nearby were compared to average expression value of all genes. Genes that had a DNase HS site nearby had higher levels of gene expression in all primary tissues. In addition, the highest levels of gene expression were from peripheral blood cell types, including natural killer (NK), monocytes, B cells, and CD8+ and CD4+ T cells. (B) Average expression values of genes that are associated with different cluster sizes were determined from CD4+ T cells as well as the averaged gene expression from all primary tissues (all cell types). “All genes” represents the average expression value of all genes on the Affymetrix U133A expression array.


