
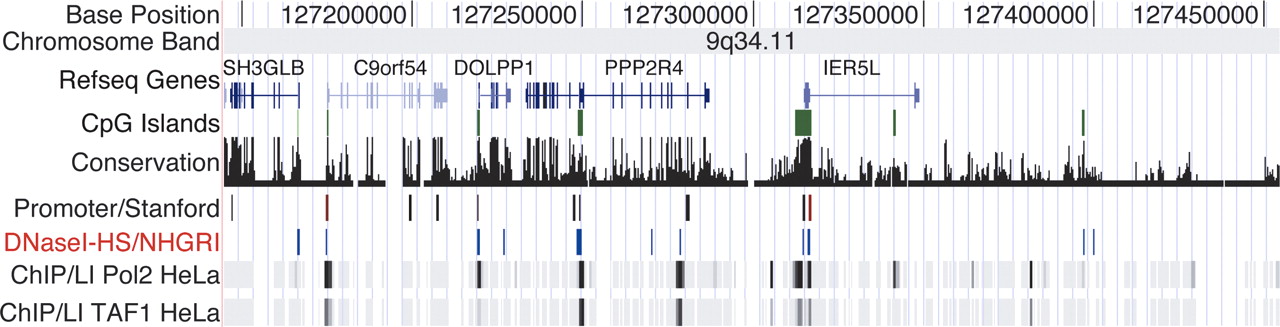
An example of multiple genome-wide technologies used to identify gene regulatory elements. This is a screen shot from the UCSC genome browser ENCODE region Enr232 (chr9: 127,144,681-127,454,484). Shown in the DNase I-HS/NHGRI track are the locations of DNase clusters of two or more, as well as other data tracks. Names and location of exons and introns are indicated in RefSeq Gene track. The conservation track measures the degree of sequence conservation among human, chimp, mouse, rat, and chicken. The Promoter/Stanford track displays relative activity of predicted promoters in luciferase reporter assays (Trinklein et al. 2003). ChIP/L1 displays ChIP-chip data for DNA Polymerase II (Pol2) and transcription initiation factor TFIID subunit 1 (TAF1) from HeLa cells, as determined by the University of California at San Diego (Kim et al. 2005). Note the overlap of many experimental data types.


