
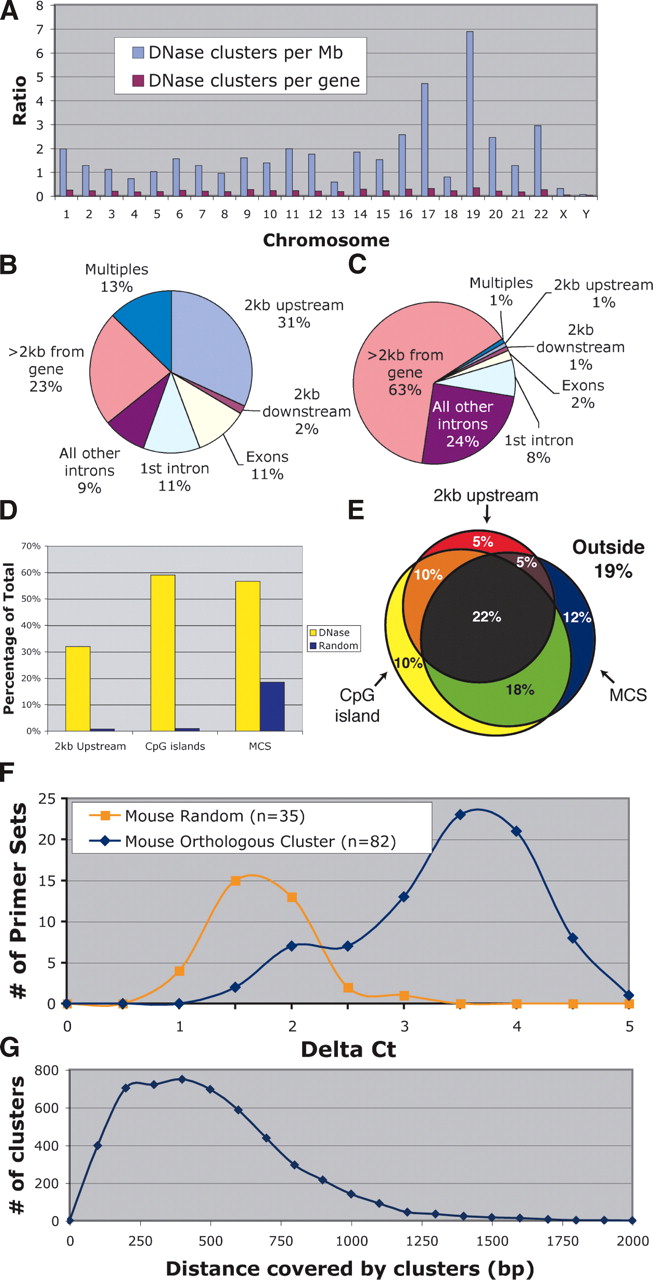
Location of DNase clusters of three or more relative to the annotated genome. (A) DNase clusters were mapped to each chromosome, and the density of sites per Mb was determined (blue bars). DNase clusters are significantly overrepresented on chromosomes 17 and 19, which are known to be especially gene rich. No differences were detected when the density of DNase clusters per gene was determined for each chromosome (red bars). (B) The location of DNase clusters relative to genes was determined. Multiples represent DNase clusters that were <2 kb from more than one gene. (C) For comparison, a library of randomly chosen coordinates was also mapped relative to genes. (D) The percentage of DNase and random sites that map to annotated regions of the genome often used to search for gene regulatory elements; regions <2 kb upstream of genes, within CpG islands, and within multispecies conserved sequences (MCS). (E) A Venn diagram shows the percentage of DNase clusters that map within one or more annotated regions of the genome (each region is represented by a circle or oval). “Outside” represents the percentage of DNase HS sites that do not map to any of the three categories. (F) Most human DNase HS sites are also hypersensitive at orthologous regions (mouse cluster) in mouse. These regions displayed higher Δ Ct values than do randomly selected controls. (G) Size of DNase HS sites (in base pairs) was calculated by subtracting the start and stop positions of each DNase cluster.


