
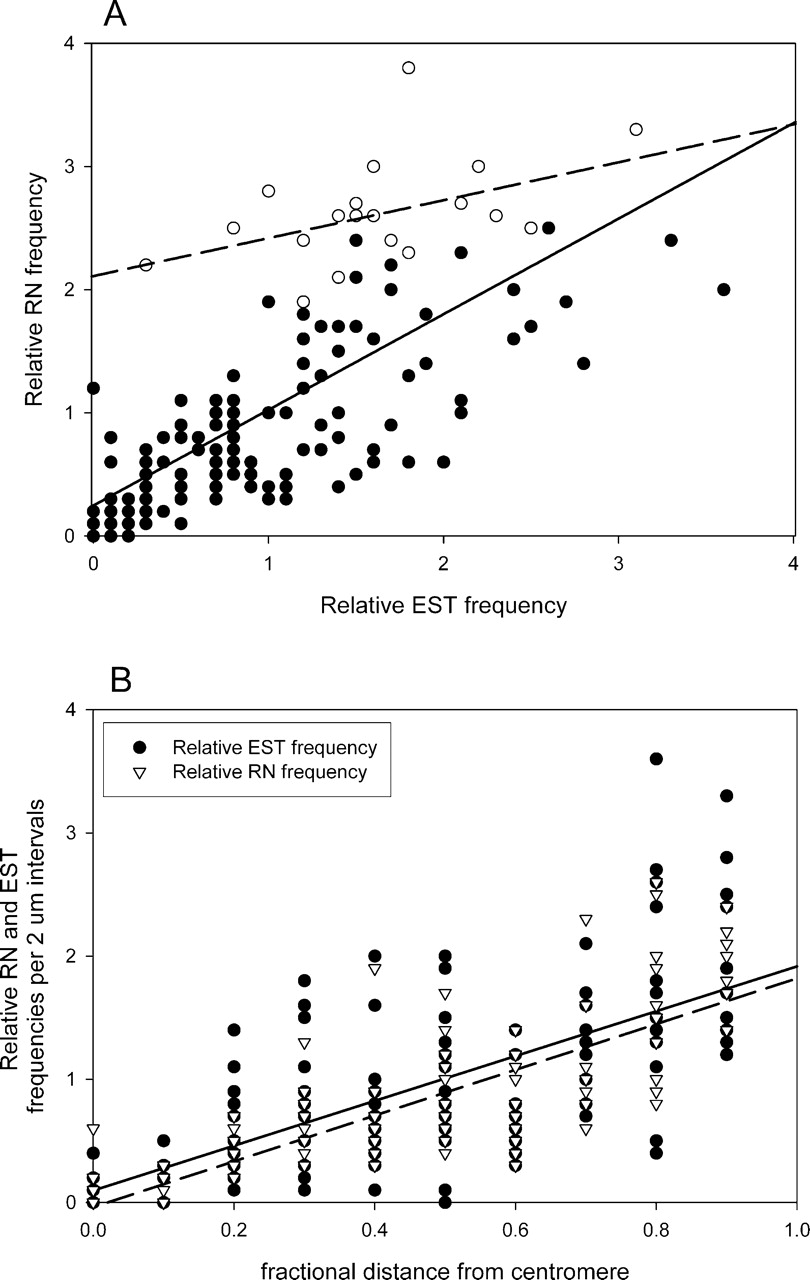
Relationship between the relative frequencies of ESTs and RNs on pachytene chromosomes. (A) For all 2-μm chromosome intervals. Open circles indicate telomeric intervals, and filled circles indicate all the other intervals. There is some overlap so not all points are visible in the graph. The regression line for all points is solid (y = 0.78x + 0.25, r2 = 0.47), and the regression line for the telomeric intervals only is dashed (y = 0.31x + 2.1, r2 = 0.20). (B) As a function of fractional arm distance of the interval from the centromere. Data for all 20 arms are pooled together, but the telomeric intervals have been omitted. The regression line for ESTs (filled circles) is solid (y = 1.81x + 0.10, r2 = 0.44), and the regression line for RNs (open triangles) is dashed (y = 1.86x–0.04, r2 = 0.64).


