
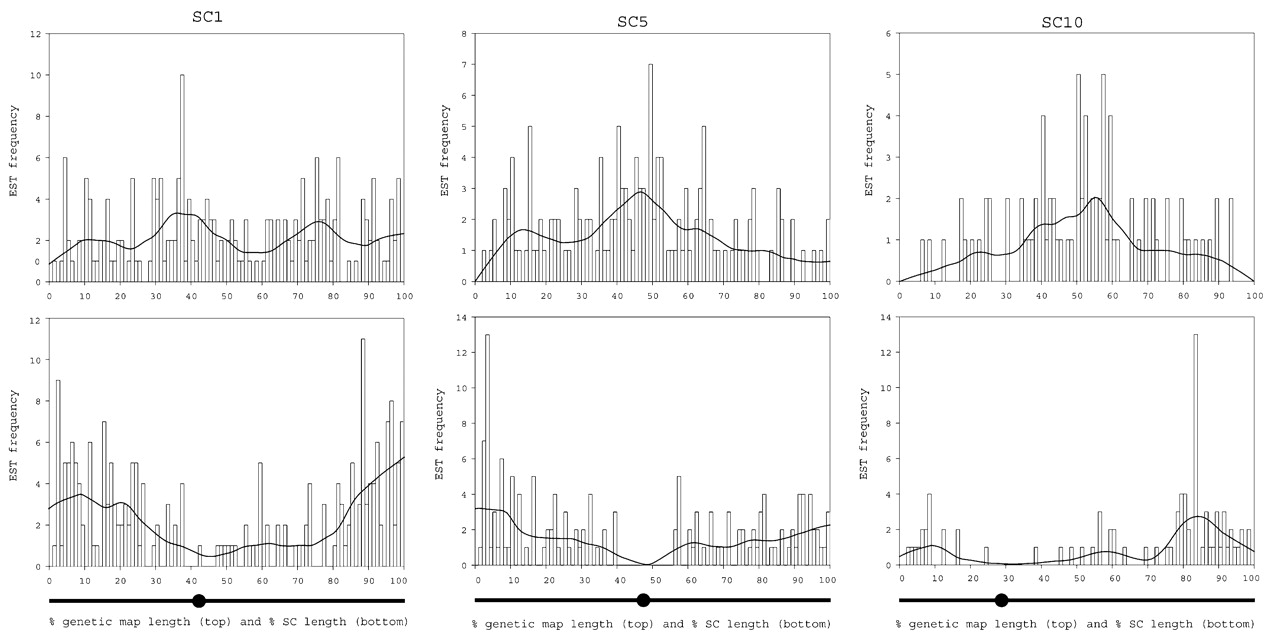
The distribution of ESTs from maize chromosomes 1, 5, and 10 in 1-cM bins on genetic linkage maps (top panel) and in 0.2-μm length bins on the physical structure of pachytene chromosomes (bottom panel). Underneath each graph is a representation of the pachytene chromosome (SC) with the short arm to the left and a circle marking the centromere. The genetic and chromosome maps of all three chromosomes are drawn to the same percentage scale. The genetic lengths have been normalized to fit the shorter RN map; otherwise the marker positions are the same as the IBM2 neighbors frame maps. The curve superimposed on each graph is a lowess smoothing function that shows the general trends of the distributions. For similar distributions for the other seven chromosomes, see Supplemental Figure 1.


