
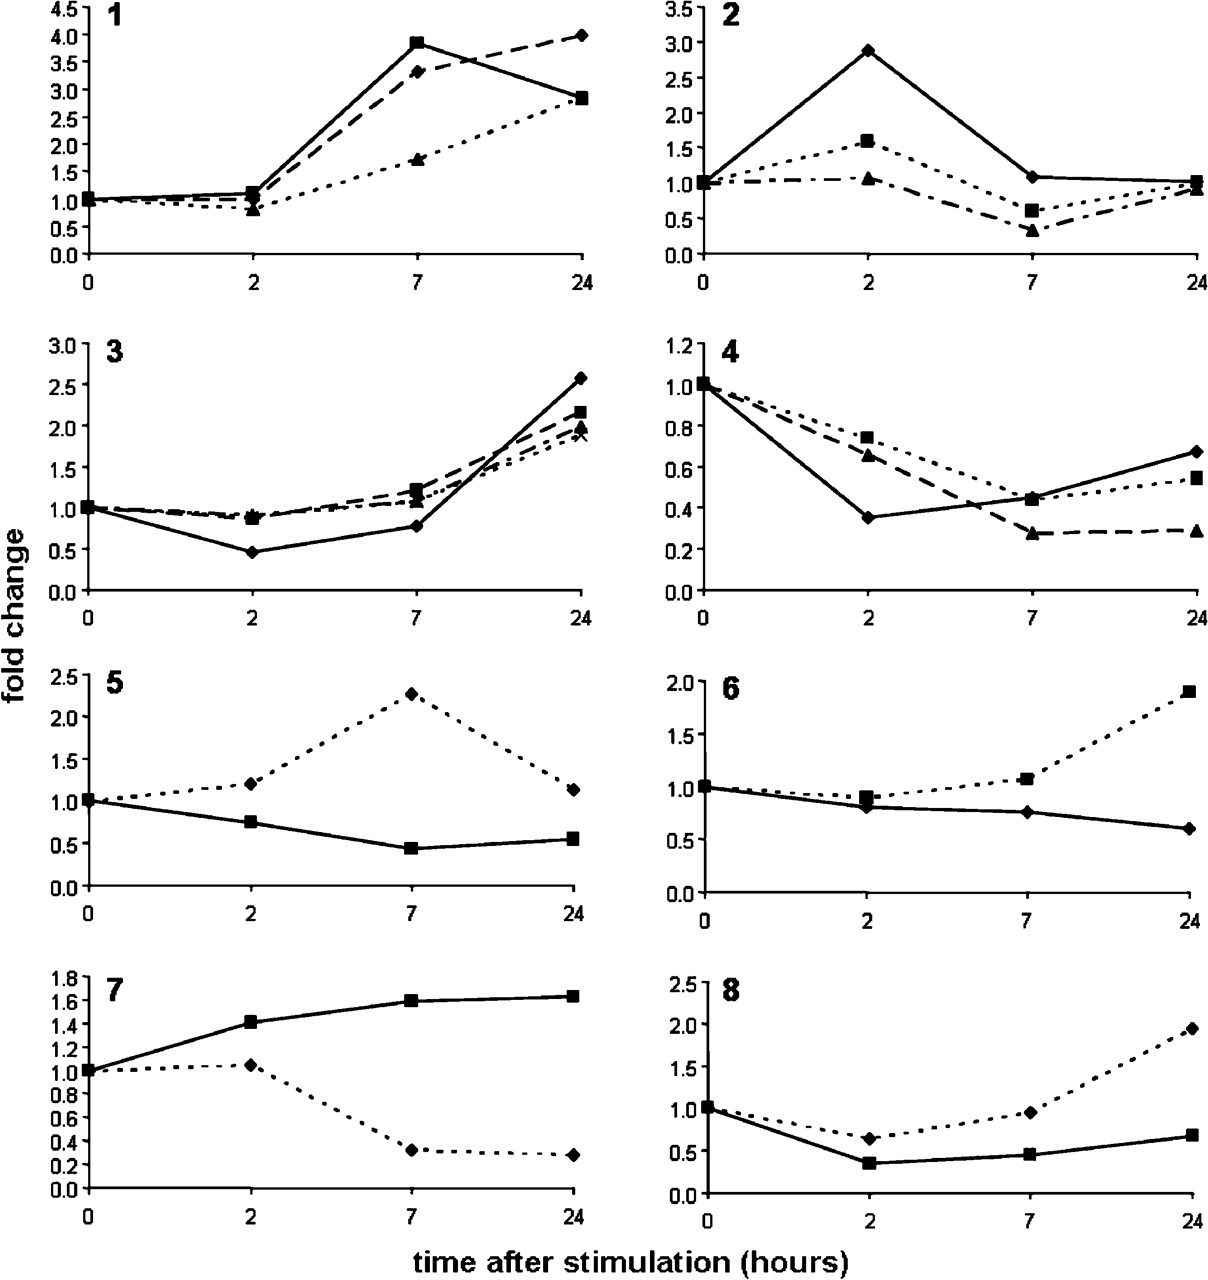
Dynamics of the expression of putative ncRNAs during macrophage activation by LPS. Panels 1-4 show quantitative real-time PCR profiles for 13 selected ncRNAs, as follows: (1) AK008526 (- ♦ -), AK017043 (—▪—), and AK007024 (- ▴ - -); (2) AK019555 (- - ▴ - -), AV079268 (—♦—) and AK017039 (- ▪ - -); (3) AK009126 (- ▪ -), AK033985 (—♦—), AK017432 (x - -), and AK007998 (- - ▴ - -); (4) AK008218 (- ▴ -), AK018521 (—♦—), and AK035433 (- - ▪ -). Panels 5-8 show examples of expression patterns of selected sense-antisense pairs of ncRNAs with their cognate protein-coding transcripts in macrophages. The sense-antisense pairs are mRNAs (- - ♦ - -) and ncRNAs (—▪—), as follows: (5) Cacnb4/AK035433 (correlation coefficient = -0.77, P-value = 0.23); (6) Ubxd6 (Rep-8)/AK017432 (correlation coefficient = -0.83, P-value = 0.17); (7) Atp5l/AK017092 (correlation coefficient = -0.79, P-value = 0.21); (8) Slc22a6/AK018521 (correlation coefficient = 0.54, P-value = 0.46). RNA was isolated at time 0, and at 2, 7, and 24 h after LPS stimulation. The abscissa indicates the average fold change in ncRNA/mRNA expression compared to time 0.


