
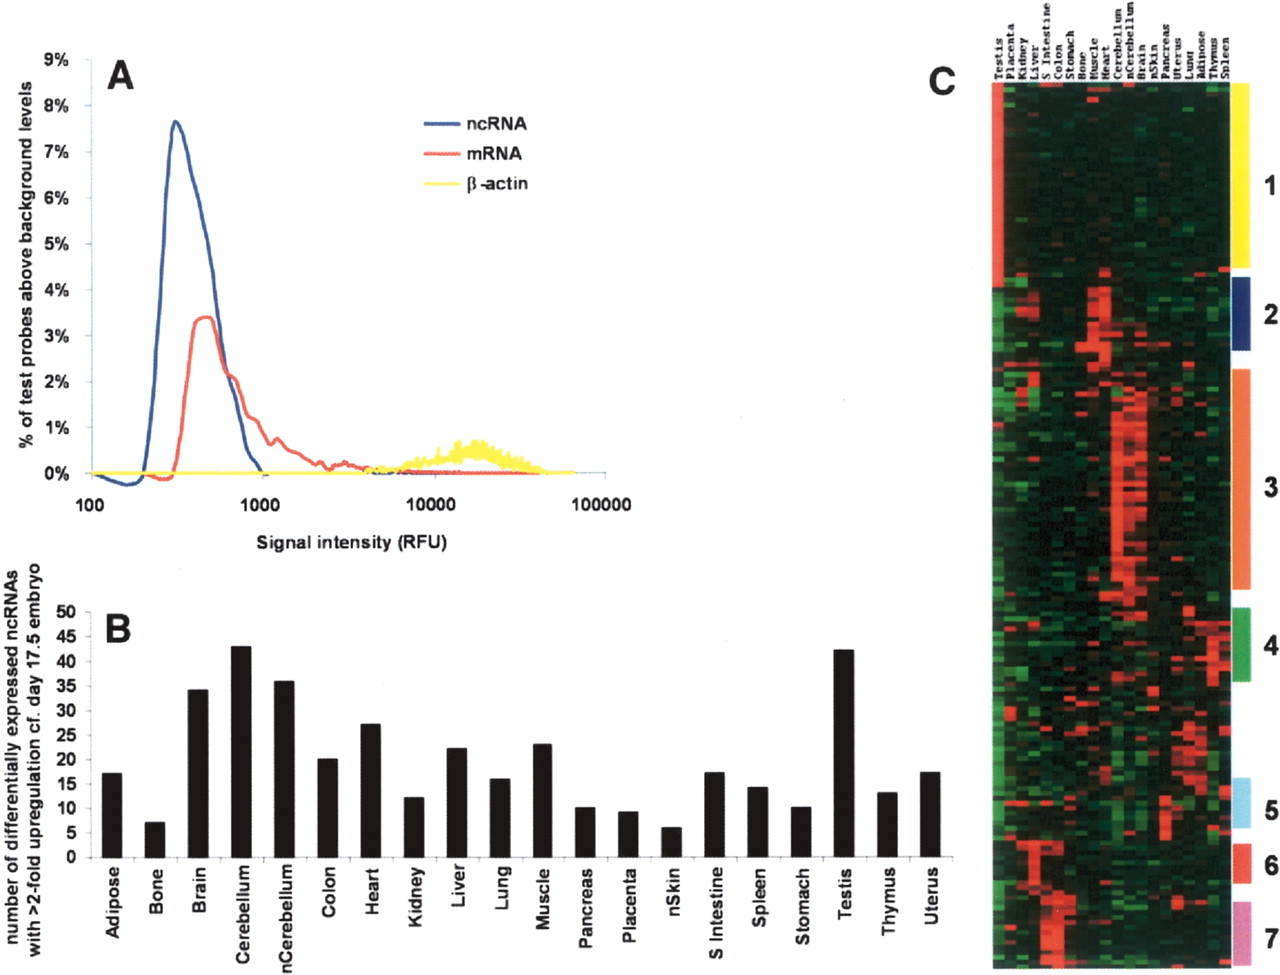
Tissue profiling of putative ncRNAs. RNA was isolated from 20 mainly adult tissues, and corresponding cDNA probes were prepared and hybridized to RIKEN 20K-2 microarrays as described in Methods. (A) Relative frequency histogram of signal intensity of mRNAs and filtered ncRNAs in the microarrays. Mean signal intensity values for each sequence were calculated for individual tissues relative to negative control cDNAs from Arabidopsis (Accession nos. X98108, X13611, X90769, Z99707, AF004393, Z49777, Q03943, U58284) and a positive control (β-actin). To compare the distribution of signals, the fluorescence values for mRNAs and ncRNAs were grouped into bins of every 100 relative fluorescence units (RFU). The number of signals within each bin was then converted to a percentage of the total number of signals across all tissues for each category. To distinguish real from background levels, the background frequency for each bin (as estimated by the Arabidopsis controls) was subtracted from each of the remaining three groups, and the resulting relative frequency values were plotted. (B) Tissue distribution of up-regulated ncRNAs. Here 178 differentially expressed ncRNAs with >2-fold up-regulation relative to the day 17.5 whole embryo reference tissue were identified using Welch ANOVA with Bonferroni multiple testing correction (P = 0.01). To determine tissue distribution, the number of up-regulated ncRNAs within each tissue was calculated and plotted. (C) Hierarchical clustering of up-regulated ncRNAs. Here 178 differentially expressed ncRNAs showing greater than twofold up-regulation in expression were hierarchically clustered according to tissue expression using the Cluster tool (Eisen et al. 1998). Groups of clones showing tissue-specific expression patterns are indicated: (1) testis; (2) muscle; (3) central nervous system; (4) thymus; (5) pancreas; (6) liver; (7) enteric tract. Tissues labeled with “n” are neonatal tissues. The primary data used for the cluster analysis, including the GenBank ID numbers and the relative intensity ratios of the differentially expressed ncRNA sequences, are given in Supplemental Table 5.


