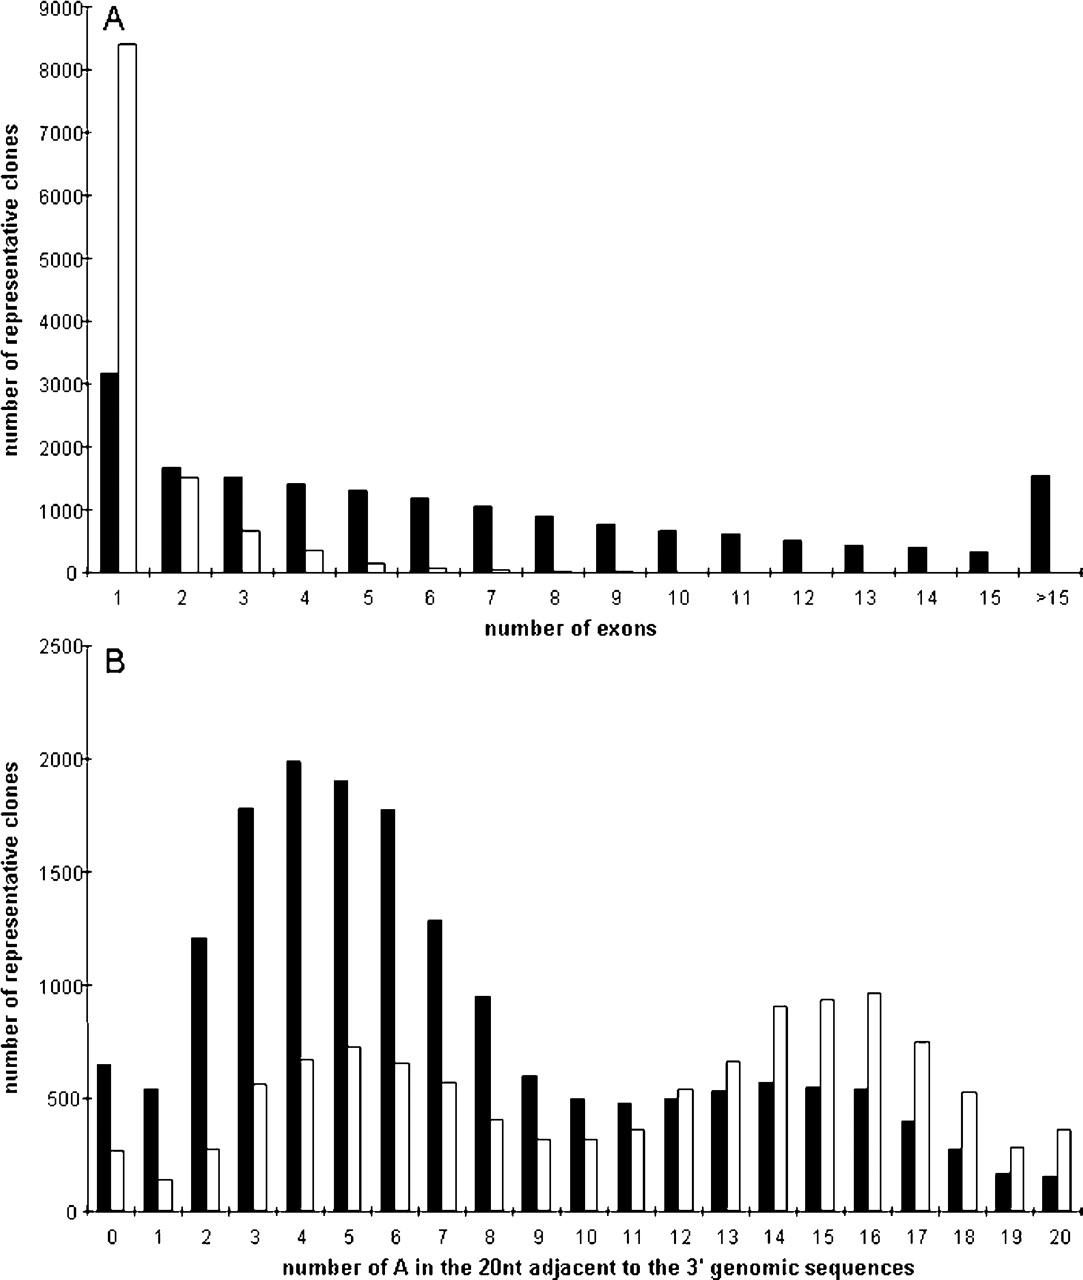
Experimental validation of the regulated expression of large numbers of non-coding RNAs from the mouse genome

(Downloading may take up to 30 seconds. If the slide opens in your browser, select File -> Save As to save it.)

Click on image to view larger version.

Figure 1.
Figure 1.

(A) Distribution of exon number in mRNAs and putative ncRNAs. (B) Distribution of the number of As within the following 20 nt of the adjacent 3′ genomic sequence. The black bars are mRNAs (protein coding and flanking exonic sequences), and the white bars are putative ncRNAs.

This Article

  1. Genome Res. 16: 11-19

Preprint Server