
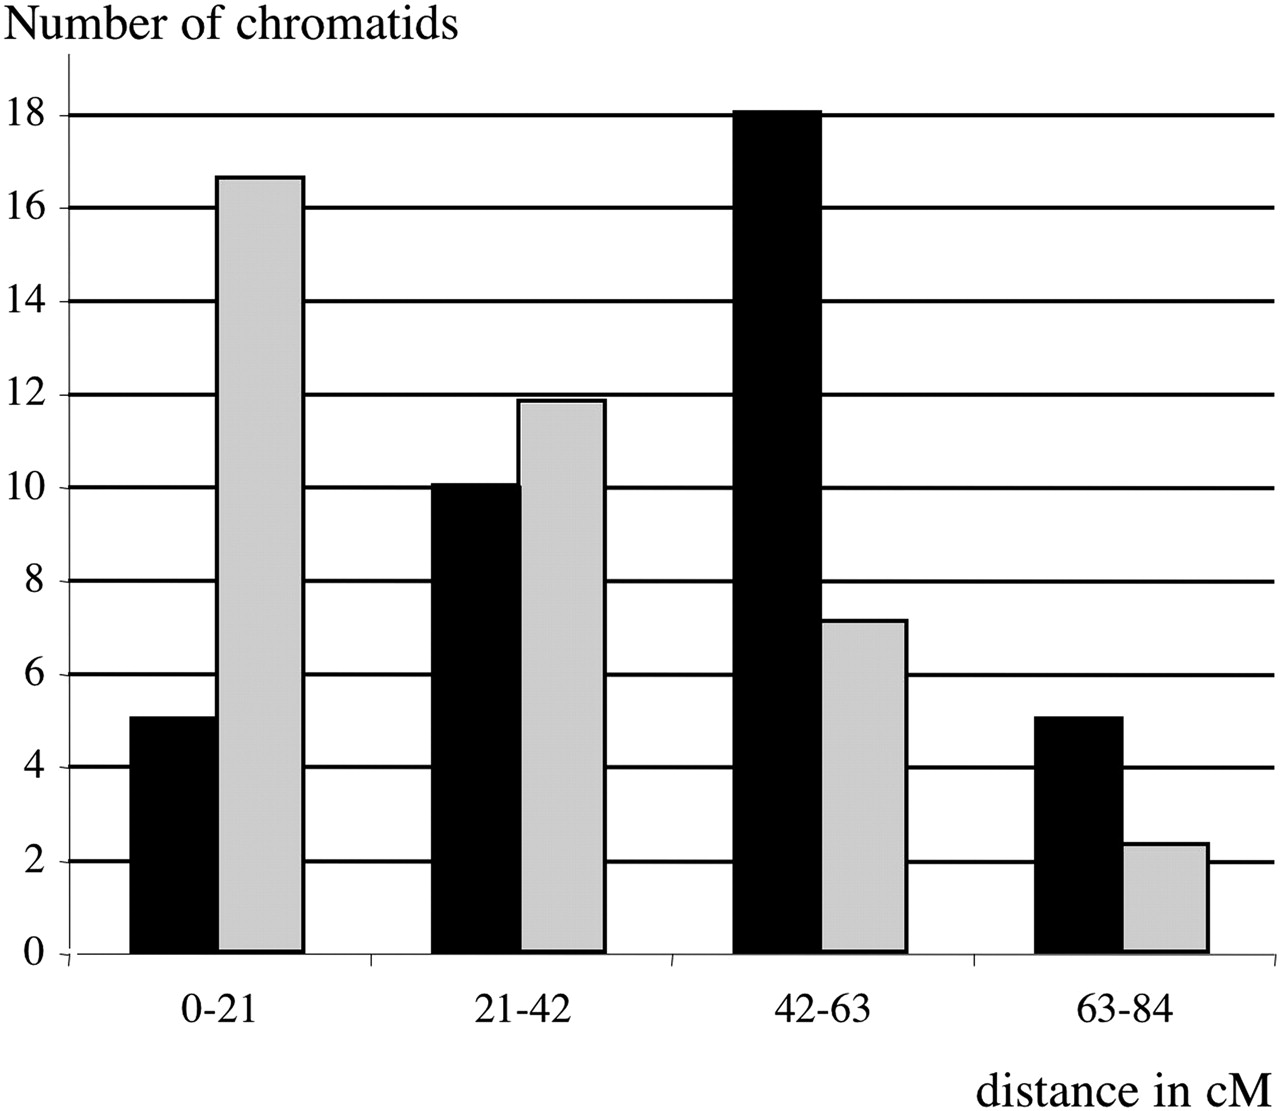
Figure 4.
Distribution of the distances in centiMorgans between double COs. (Histogram in black) observed distribution of double COs in our F2 (see text); (histogram in gray) theoretical distribution of double COs if the position of one CO is independent of the second (Methods).


