
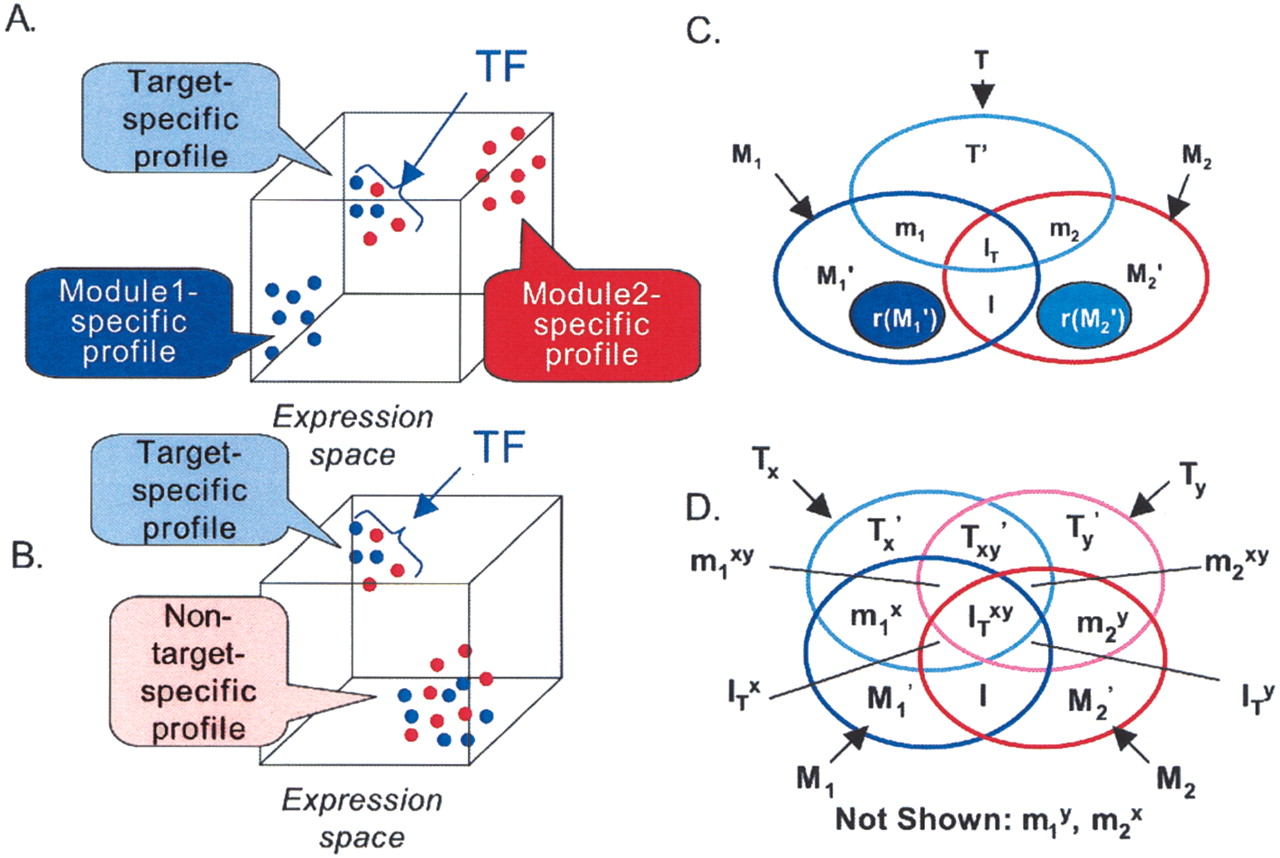
Coherence of target gene expression profiles. (A) Distinctness of target gene expression profiles. The cube represents a three-dimensional expression space. Each dot represents
a gene from functional module 1 (blue) or functional module 2 (red), and the location of the gene on an axis represents the
expression level of the gene at the time point or condition represented by the axis. The distance that separates two genes
is inversely proportional to the “coherence” of their expression profiles. Target genes are shown as regulated by the TF (arrow).
This distribution of genes represents a hypothetical scenario in which the intermodule coherence between target genes is higher
than that between non-target genes. (B) Notation as in A. This distribution of genes represents a hypothetical scenario in which target genes and non-target genes have very different
expression profiles, even though the intermodule coherence between target genes is similar to that of non-target genes. (C) Triplet scoring notation. M1 = genes in module 1; T = genes in genome containing binding site for TF T; m1 = genes in M containing binding site for T (“target genes”); M1′ = genes in M1 that do not contain a binding site for T (“non-target genes”); rx (M1′) = x randomly selected genes from M1′; M2, m2, M2′ r |x| (M2′) defined analogously. Aggregate target genes = (m1 ∪m2) or (m1∪m2∪IT) ; aggregate non-target genes =(M1′ ∪ M2′) or (M1′ ∪ I ∪ M2′); I and IT represent non-target and target genes, respectively, that are present in both modules. (D) Quartet scoring notation. Variables are analogous to those in C, but here there are two TFs, X and Y. Tx = genes in genome containing binding site for X; Ty = genes in genome containing binding site for Y. B, X, Y, and N represent module components that are targets of both X and Y, X only, Y only, or neither TF, respectively:  .
.


