
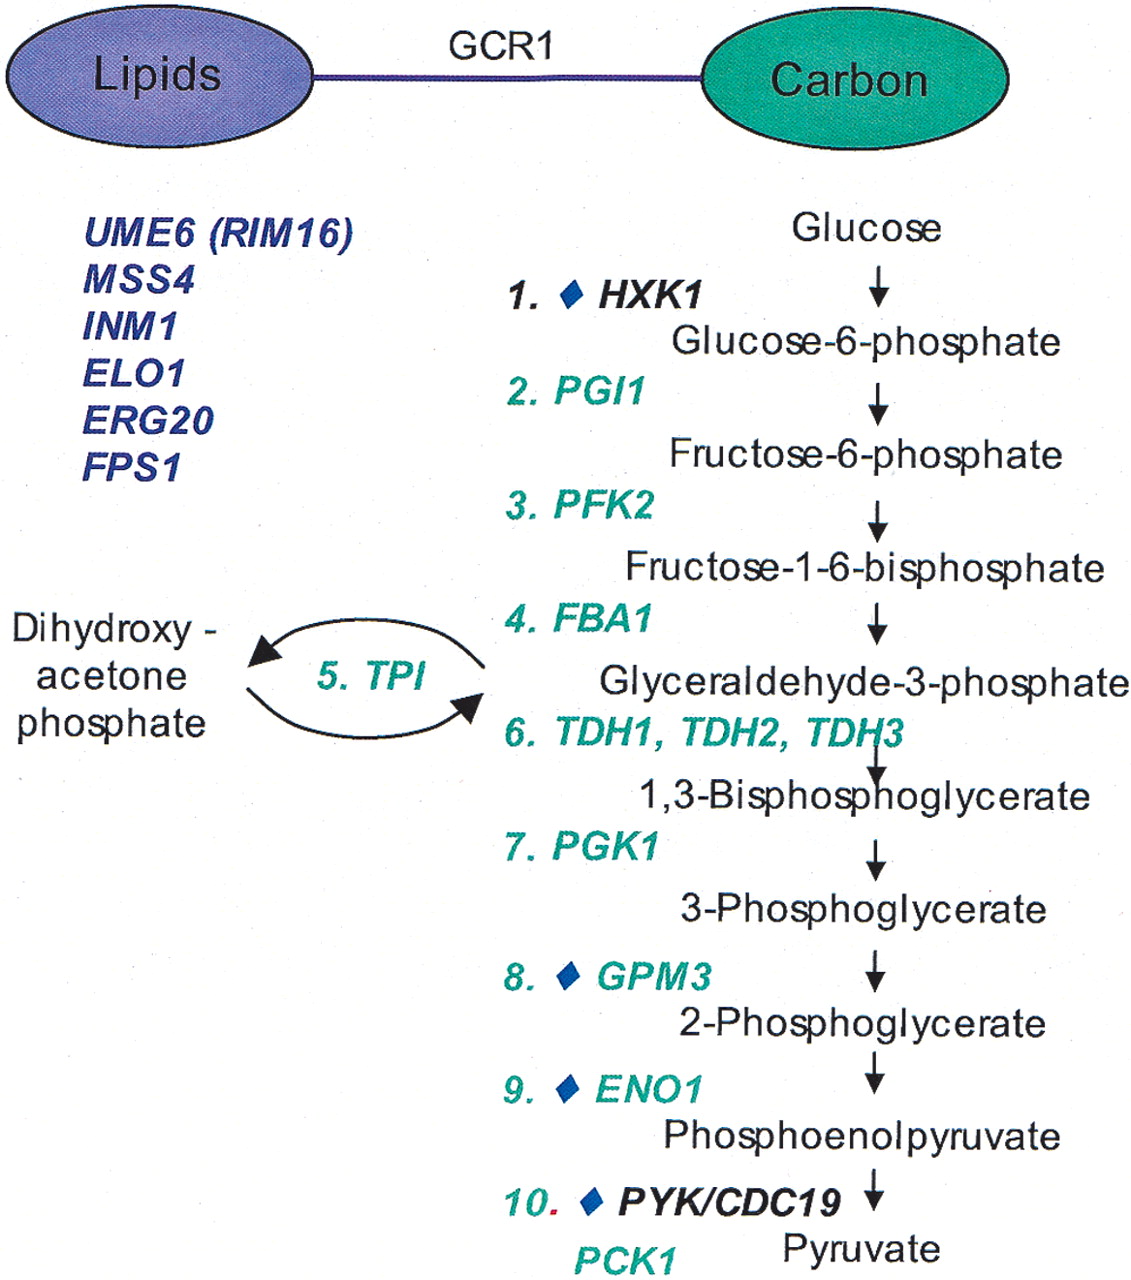
Figure 4.
Interaction between Lipid, fatty-acid, and isoprenoid metabolism and Carbon compound and carbohydrate metabolism. The two modules (colored ovals) are coregulated by the MSA TF GCR1 (purple edge) using the cell cycle expression data set. GCR1 targets in each module are shown below the modules in purple or green type; those associated with glycolysis are organized according to the superimposed chart of glycolysis. Gene names preceded by a blue diamond were shown to bind phosphoinositides using proteome chips in Zhu et al. (2001).


