
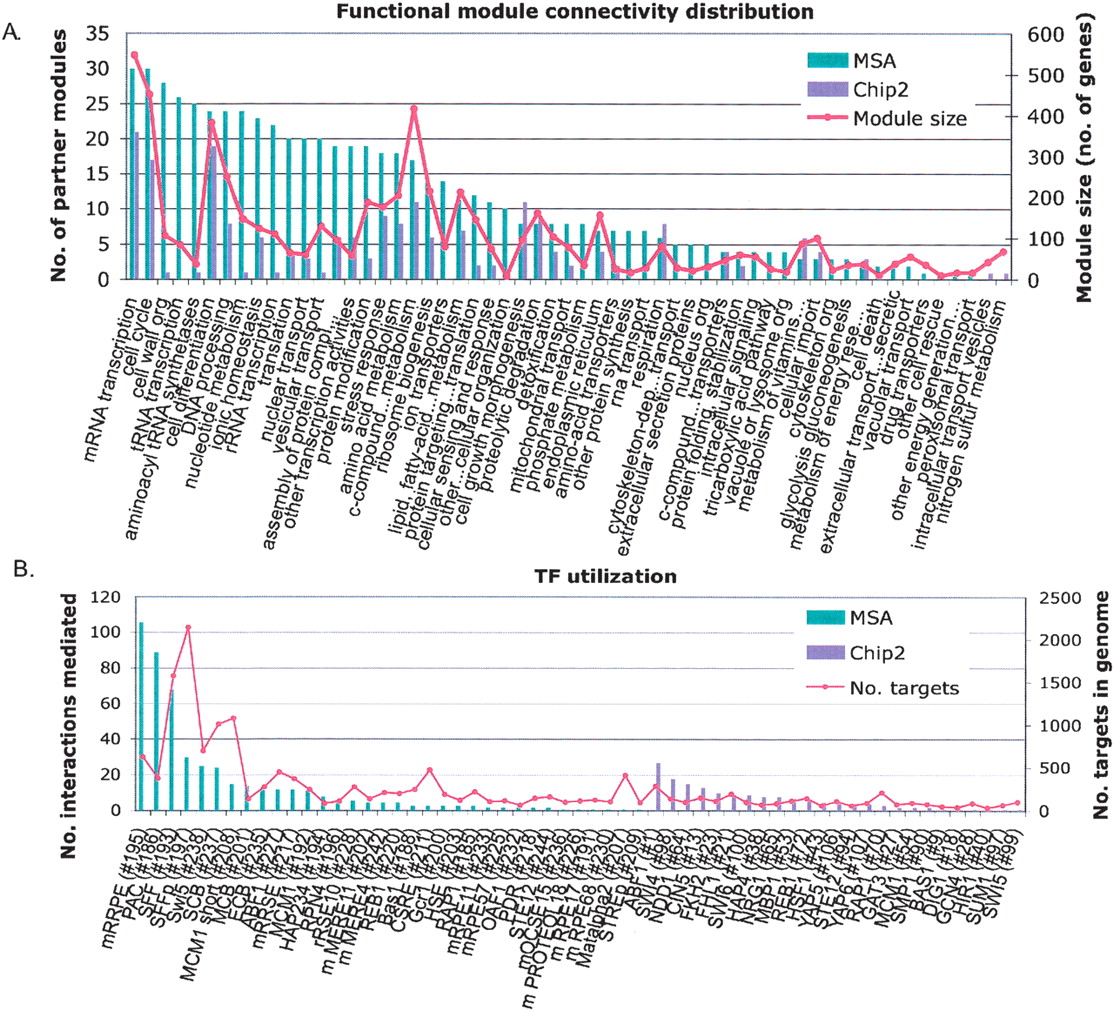
Figure 2.
(A) Functional module connectivity histogram. For each module, the number of partner modules with which it is coordinated by at least one TF in at least one expression data set is shown. (Purple columns) MSA TFs, (green columns) Chip2 TFs, (pink line) module size. (B) TF utilization histogram. The number of pairwise module interactions mediated by each TF is shown on the left-hand axis. The right-hand axis shows the number of genome-wide promoter targets for each TF. (Purple column) MSA TFs, (pink column) Chip2 TFs, (pink line) promoter targets per TF.


