
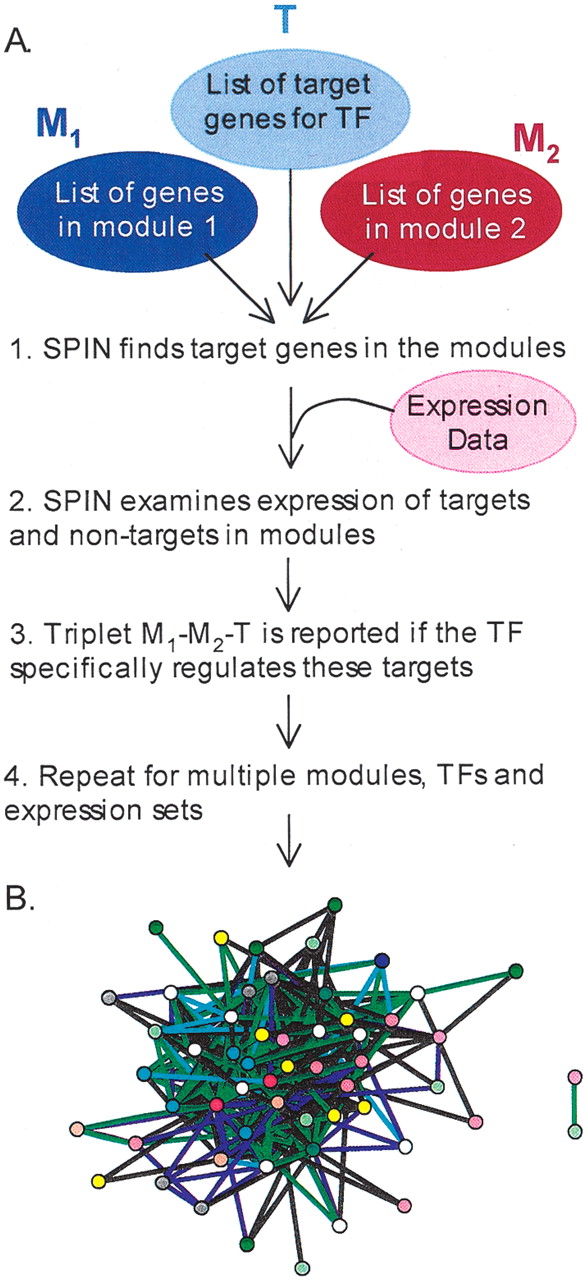
(A) General approach. (B) Global module interaction network (MSA TFs). Each node represents a functional module in the second-highest level of the MIPS hierarchy, and its color corresponds to the highest-level MIPS category of which the node is a member (see Fig. 3 legend). Each edge represents one or more MSA TFs that coordinate the transcription of genes in both modules in a statistically significant manner. Edge color represents the expression data set from which the interaction was inferred: (purple) cell cycle, (gray) diauxic shift, (turquoise) environmental stress, (green) MAPK. Supplemental Figure S4 is a more fully annotated version of this figure. This graph and others like it were drawn using Pajek (Batagelj and Mrvar 1998).


