
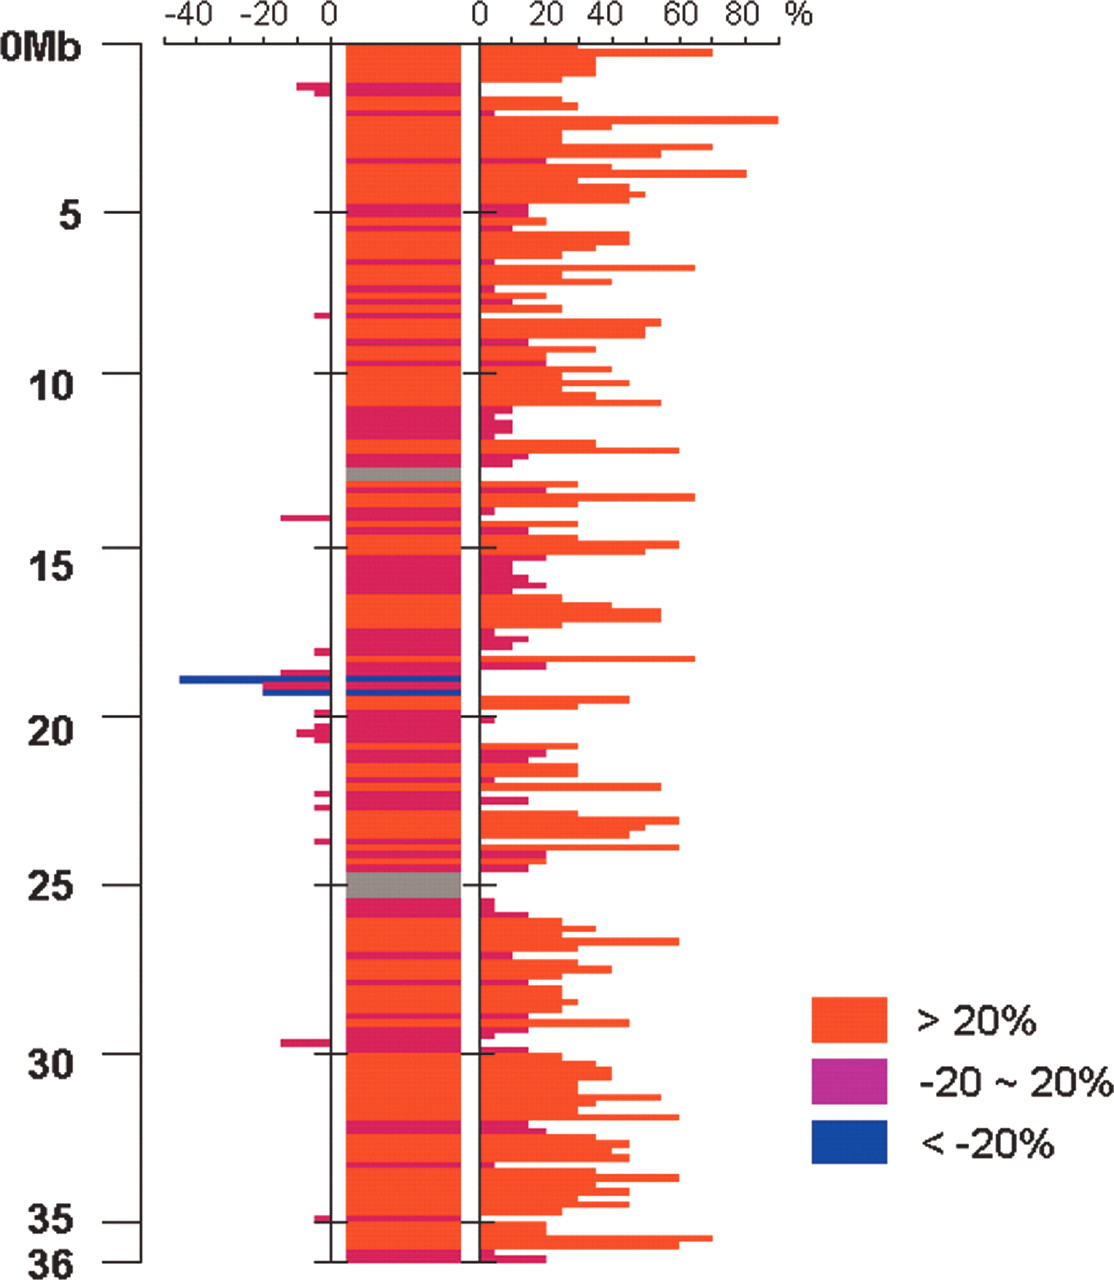
Plot of insertion/deletion/null blocks relative to the O. nivara chromosome 3 FPC map using a 200-kb sliding window across the japonica chromosome 3 pseudomolecule. Percent difference (%D) between sizes from O. nivara paired BAC ends and high-resolution HindIII fingerprints was plotted using a 200-kb window across the japonica chromosome 3 pseudomolecule, where a >20% difference is red (insertion), -20%∼20% is purple (null), and <-20% is blue (deletion). Percentage difference was calculated using the following formula: {[(paired BES size) - (FP size)]/(FP size)} × 100. A percentage decrease (left) or increase (right) was plotted on the bar graph on either side of the consensus. Regions of the japonica chromosome 3 pseudomolecule that were not covered by O. nivara paired BAC end sequences are represented in gray.


