
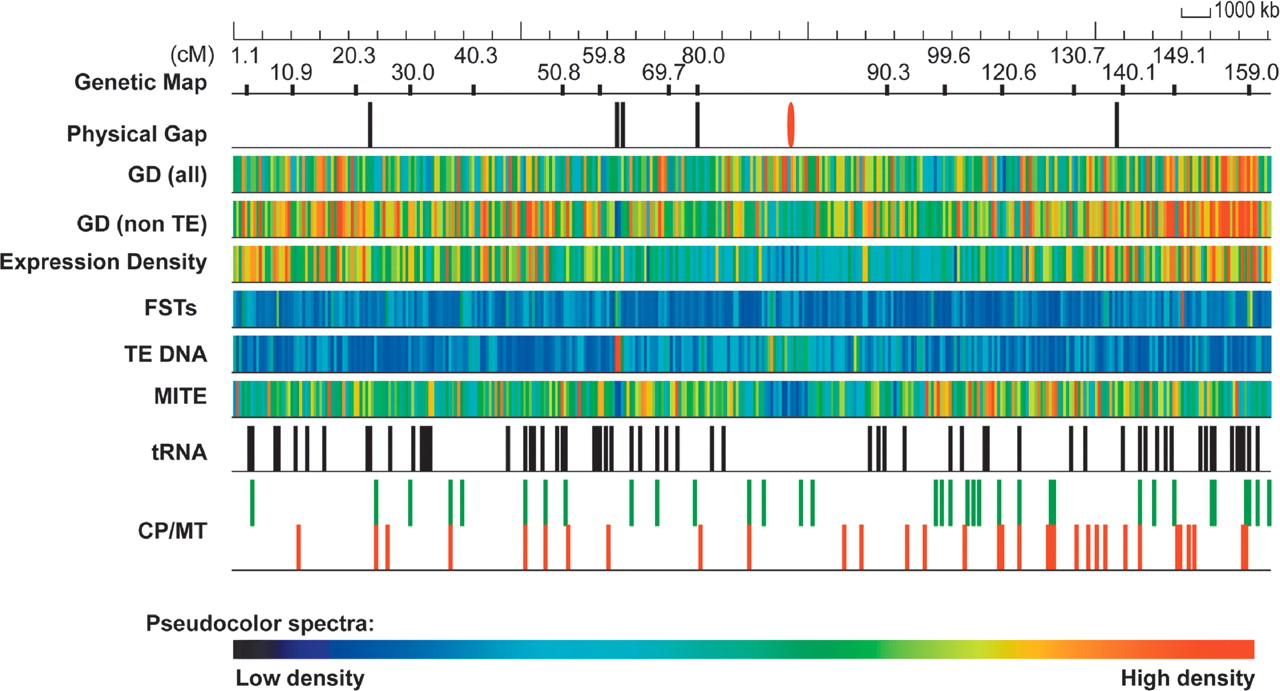
Distribution of features on japonica chromosome 3. The pseudomolecule was annotated for features including gene models, transcript evidence, repetitive sequences, tRNA genes, genetic markers, organellar insertions, and flanking sequence tags (FSTs). These are identified on the pseudomolecule using a false color display. Genetic markers are positioned at 10-cM intervals (approximately). Physical gaps are noted separately (black ticks) and include the gap at the centromere (red). Gene model density (GD) is noted in two separate tiles, all gene models and non-TE-related gene models. Expression density reflects gene models with transcript evidence. FST denotes the presence of a sequence-tagged insertion among tagged populations. Repetitive sequences are represented by the TE DNA and MITE tiles. tRNA genes and organellar insertions (CP/MT) are also denoted.


