
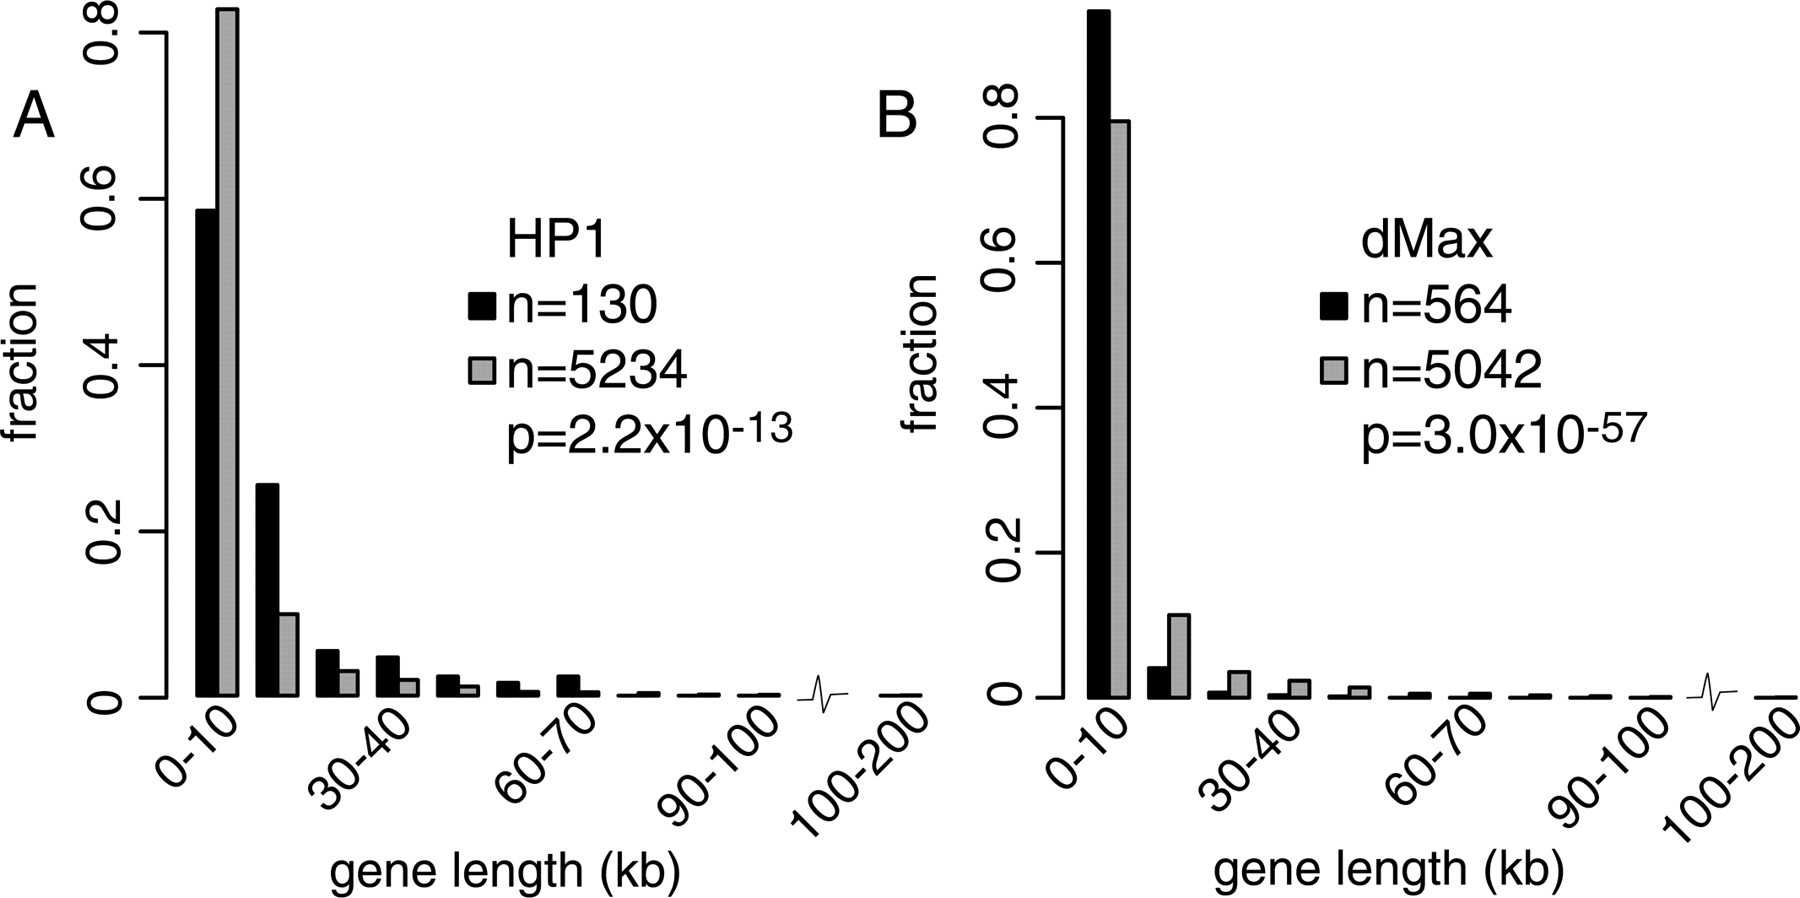
Figure 4.
Gene-length distributions for targets and non-targets of HP1. Histograms of the distributions in gene length for target genes (black) and non-target genes (gray) for HP1 (A) and control protein dMax (B). Note that sample size is different from sample size in Figure 1 because it was not possible to obtain gene length information for every clone on the microarray.


