
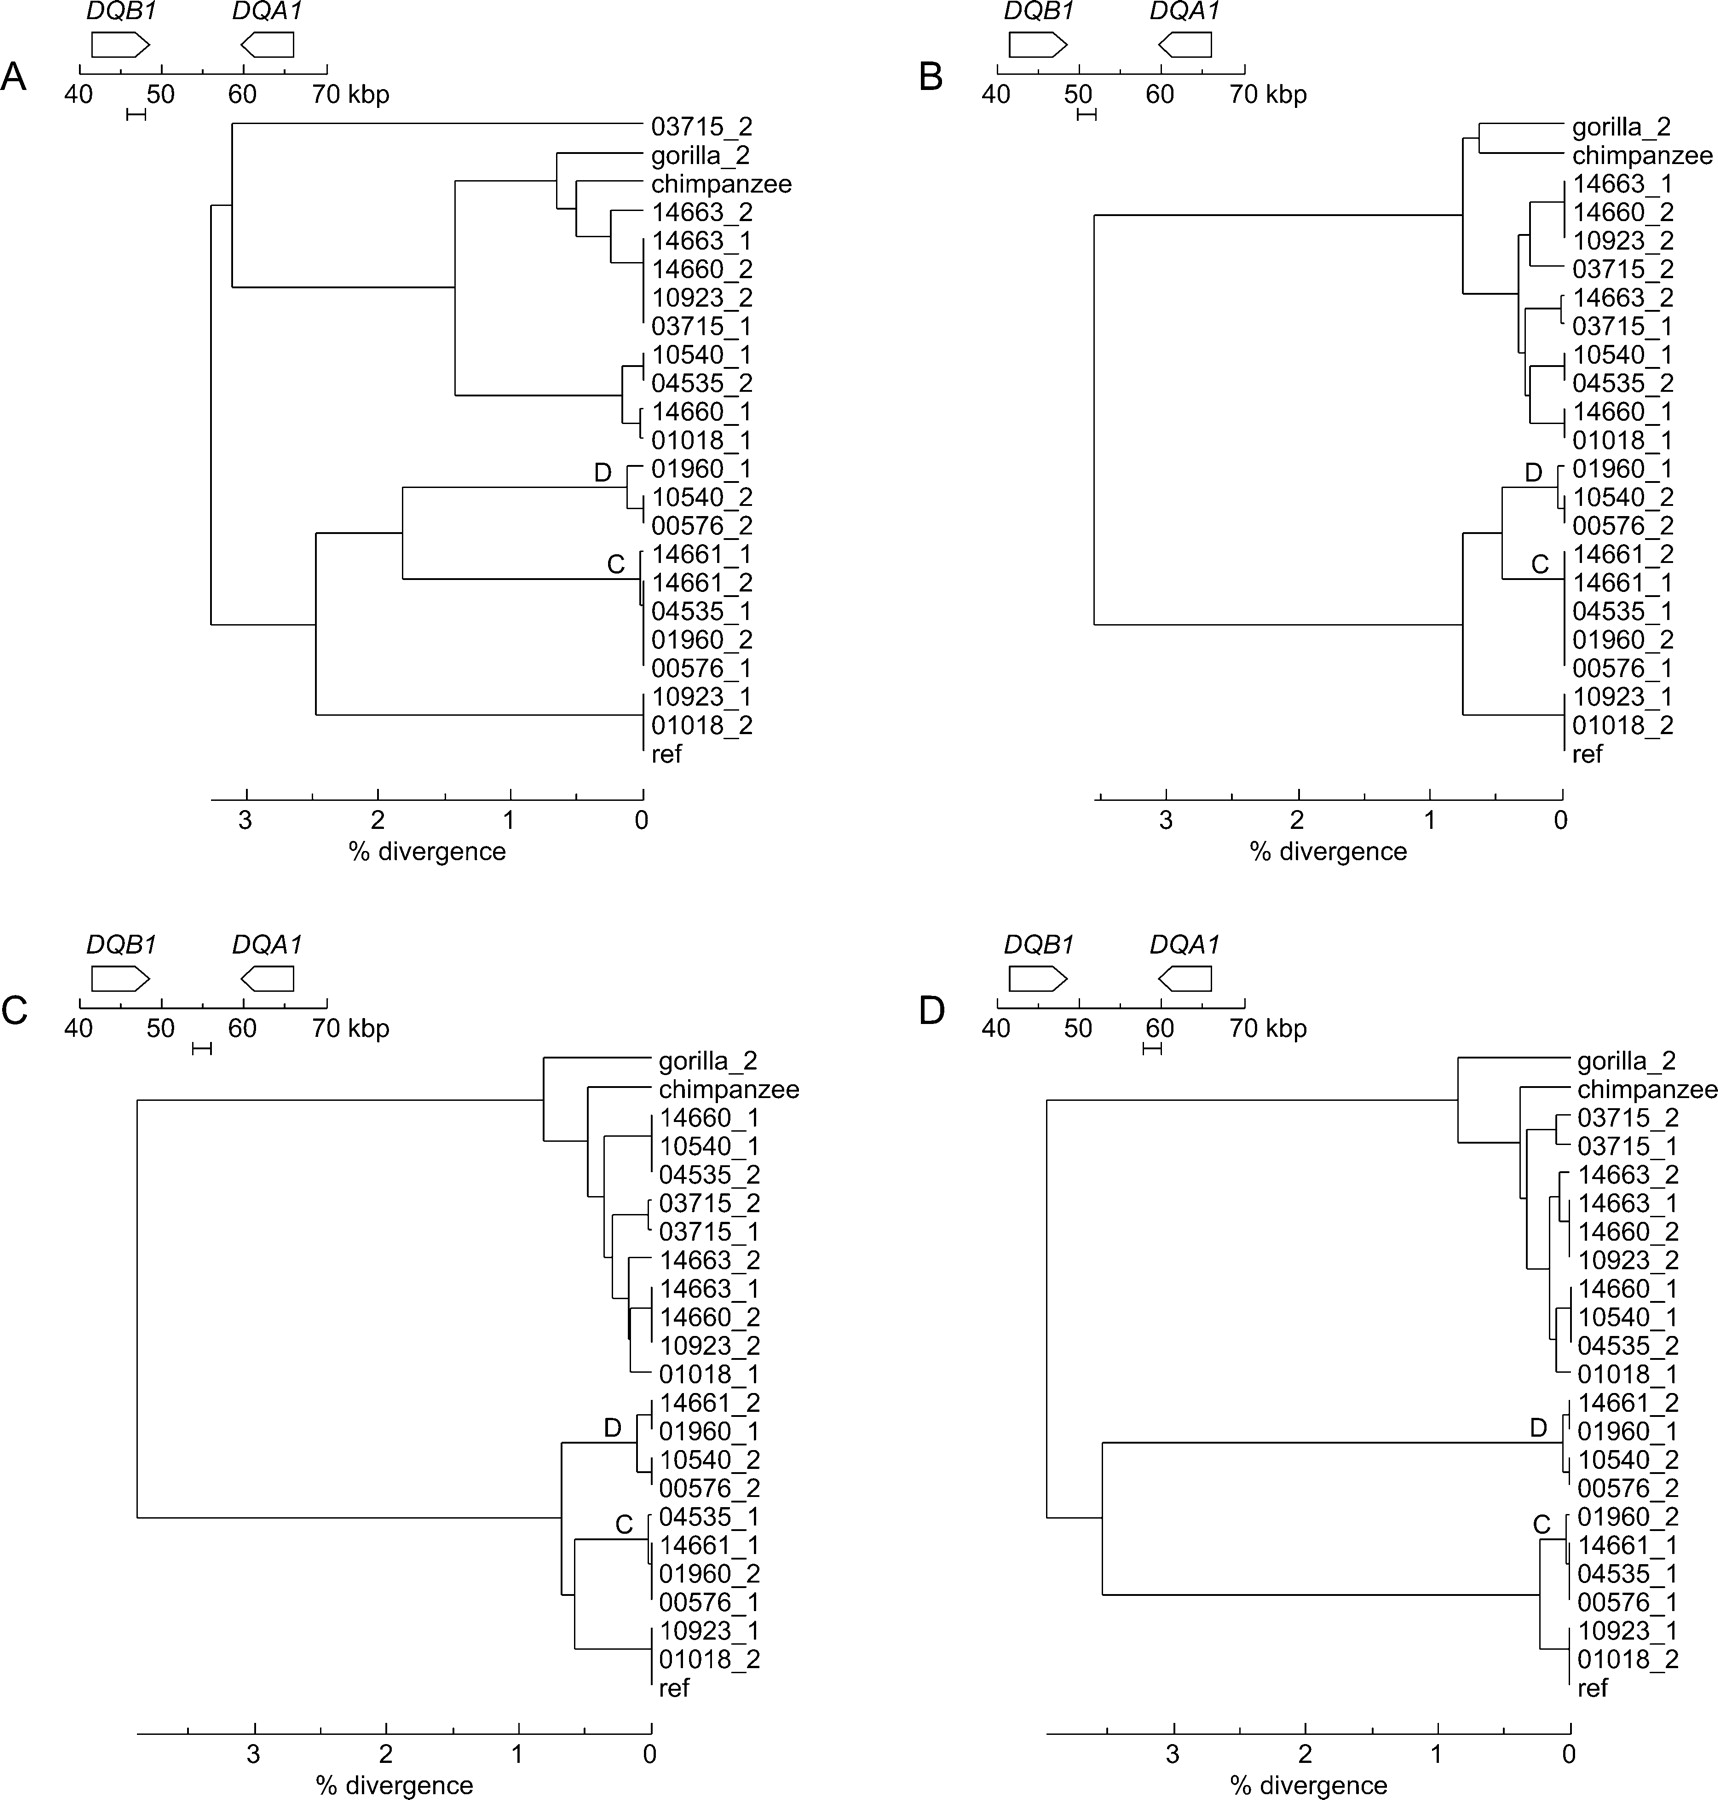
Figure 5.
Molecular phylogenies for the 23 haplotypes in four 2-kbp windows sampled from the DQB1-DQA1 interval. The coordinate system is the same as that employed in Figure 1. Parts (A-D) differ only in the position of the 2-kbp window that was analyzed: horizontal bars below the coordinate axes indicate the position of the window that was the source of data for each tree. Branches leading to C- and D-group haplotypes (see Fig. 1 legend) are labeled.


