
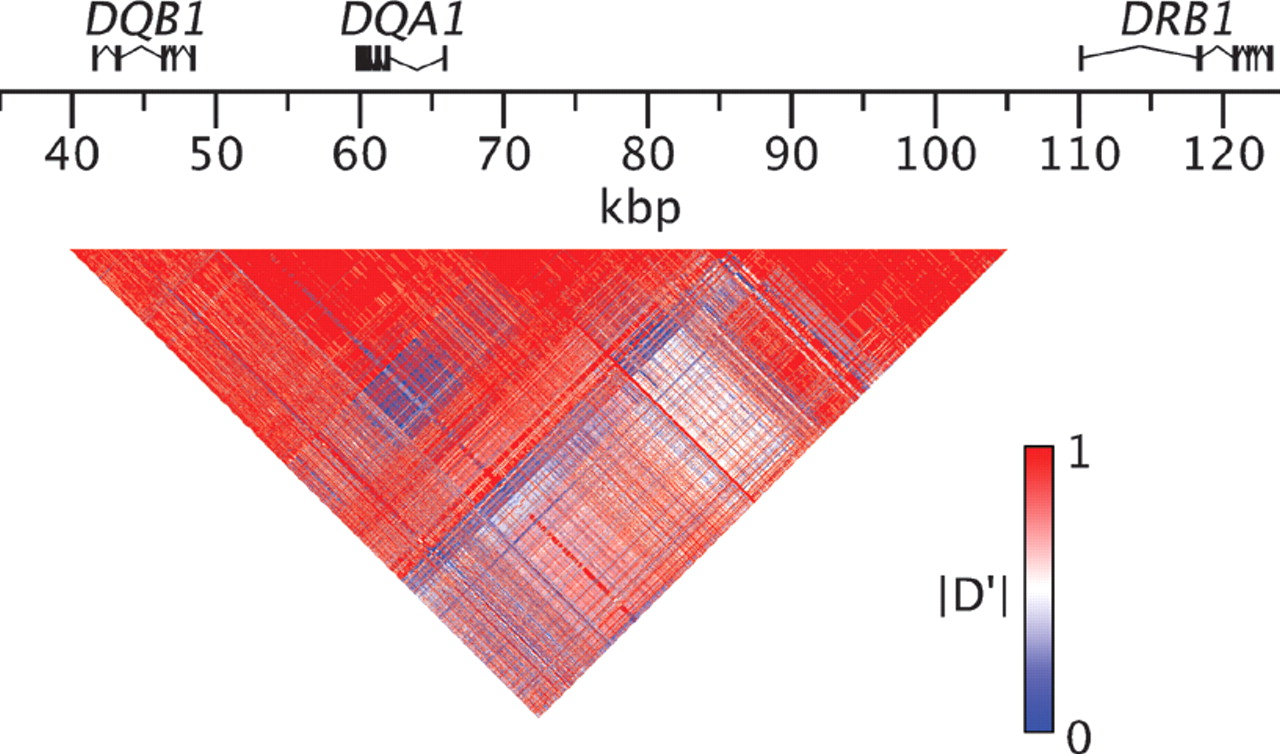
Figure 3.
Pairwise linkage disequilibrium between SNPs in the DQB1-DQA1-DRB1 region. The matrix display shows linkage disequilibrium between pairs of SNPs, measured by the statistic |D′| (see Methods). The coordinates correspond to those defined in the Figure 1 legend.


