
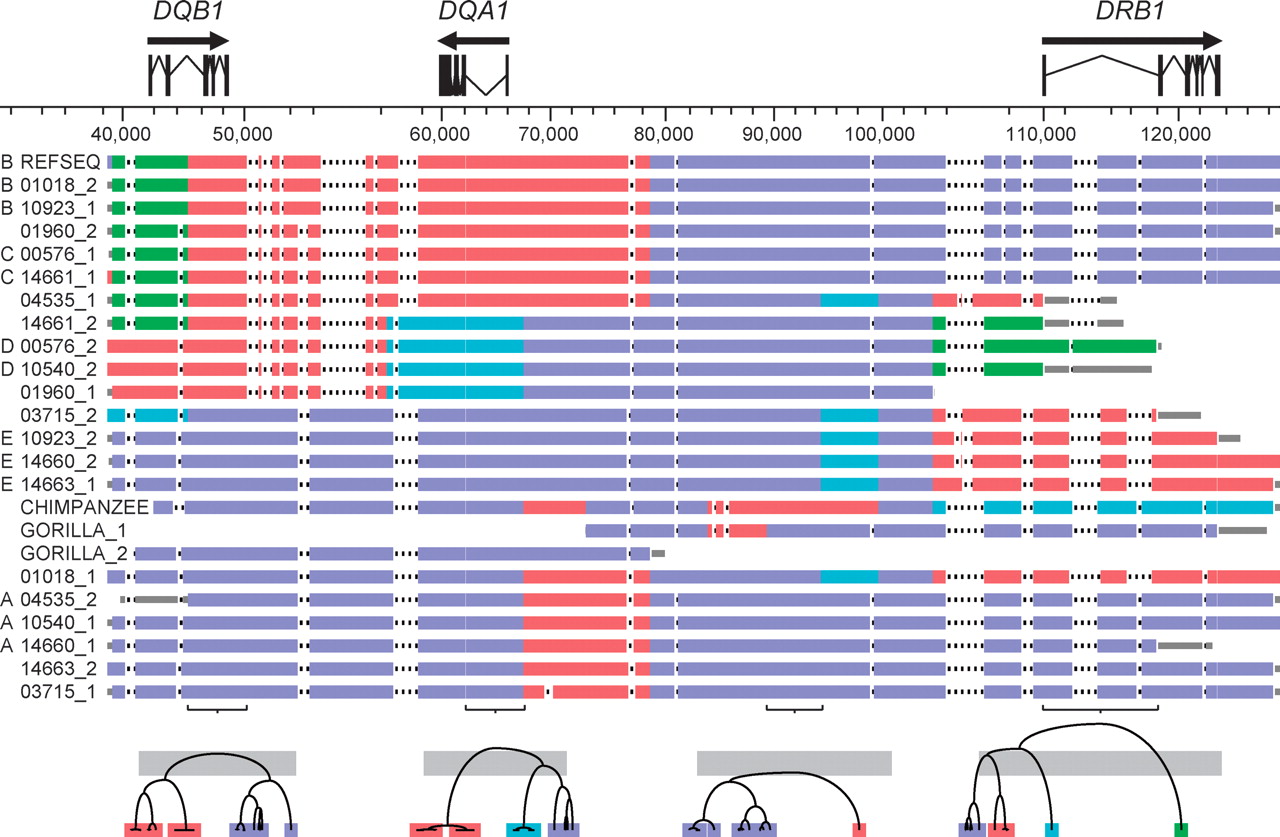
A visual representation of the multi-aligned haplotypes. The arrows over the gene models indicate the direction of transcription. Haplotype designations are indicated on the left, including membership in haplotype groups A, B, C, D, or E, when appropriate. Haplotypes within a group are nearly identical across the entire region. The coordinate system, in base pairs, is based on haplotype RefSeq (see Methods). Physical distance in the figure corresponds to the longest path through the multi-alignment; deletions relative to the longest path are indicated by gaps in the appropriate haplotypes (and, if space allows, by a series of dots). However, the tick marks and coordinates on the horizontal axis refer to RefSeq coordinates. Coloring of the haplotypes clusters them locally according to the deep branches of the phylogenetic tree to which they belong. The local clusterings were achieved by constructing molecular phylogenies for nonoverlapping 5-kbp windows across the region. Sample phylogenetic trees are shown at the bottom of the figure. The bottoms of the horizontal gray bars across the trees, which correspond to a pairwise-sequence divergence of 4%, indicate the arbitrary threshold for assigning a group of haplotypes the same color in a local region. The gray bars visible at the ends of most haplotypes are segments that could not be assigned a color in that region because they ended within one of the 5-kbp windows used for tree construction. The gorilla sequence, although treated in most instances as a single composite haplotype, is shown here as two overlapping sequences, GORILLA_1 and GORILLA_2, because these two sequences, which are true haplotypes from a single individual, are of different parental origins.


