
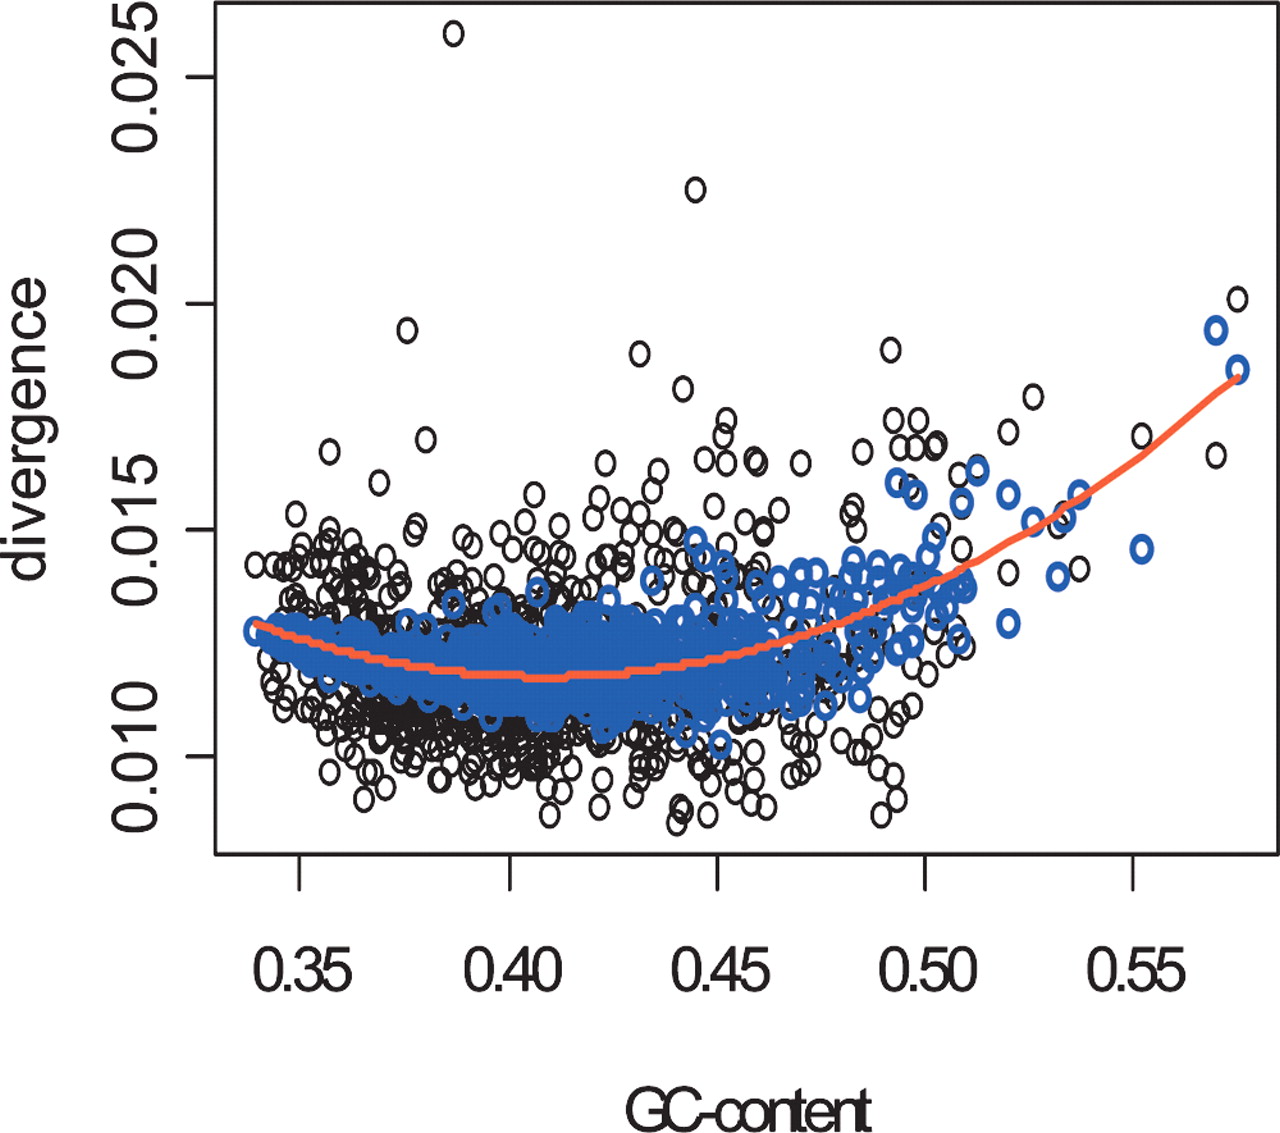
Figure 4.
The relationship between human-chimpanzee divergence and GC content is quadratic (red line) rather than linear. However, the contribution of the quadratic term becomes insignificant if CpG content is added to the model. The fitted values of this model are indicated by the blue circles.


