
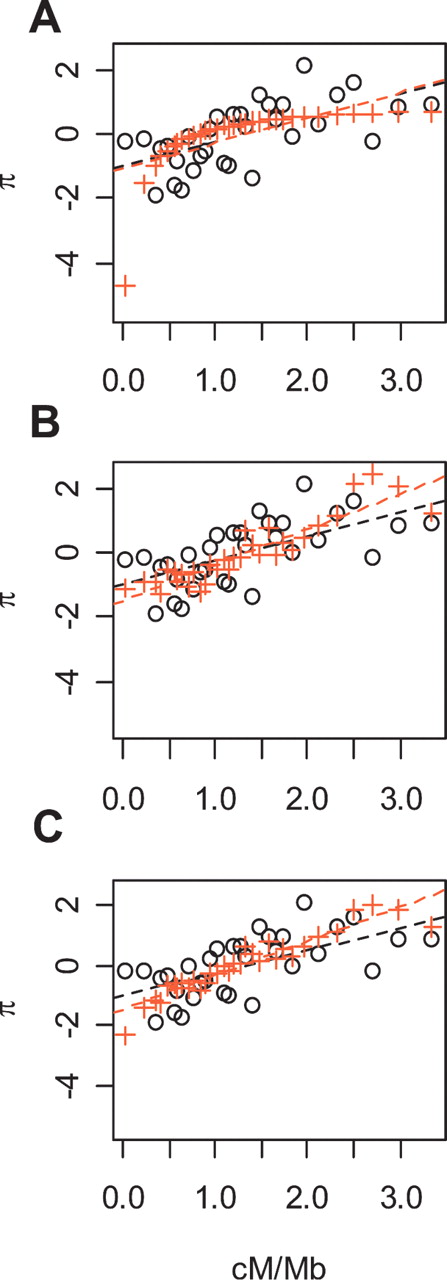
Correlation of recombination and the residuals of diversity after regression on divergence for the observed data (black dots), for simulated data (red crosses) under (A) a recurrent selective sweep model with s = 0.02 and μS =2 × 10⁻¹⁰, (B) a background selection model with μd =2 × 10⁻¹⁰ and t = 0.02, and (C) a model with both background selection and recurrent selective sweeps. We chose the parameter values for each of these three models that appeared to best fit the observed data. The points on all three curves represent means over 25 windows. To make the simulated data more comparable to the residuals of diversity, they were transformed to approximate mean 0 and variance 1.


