
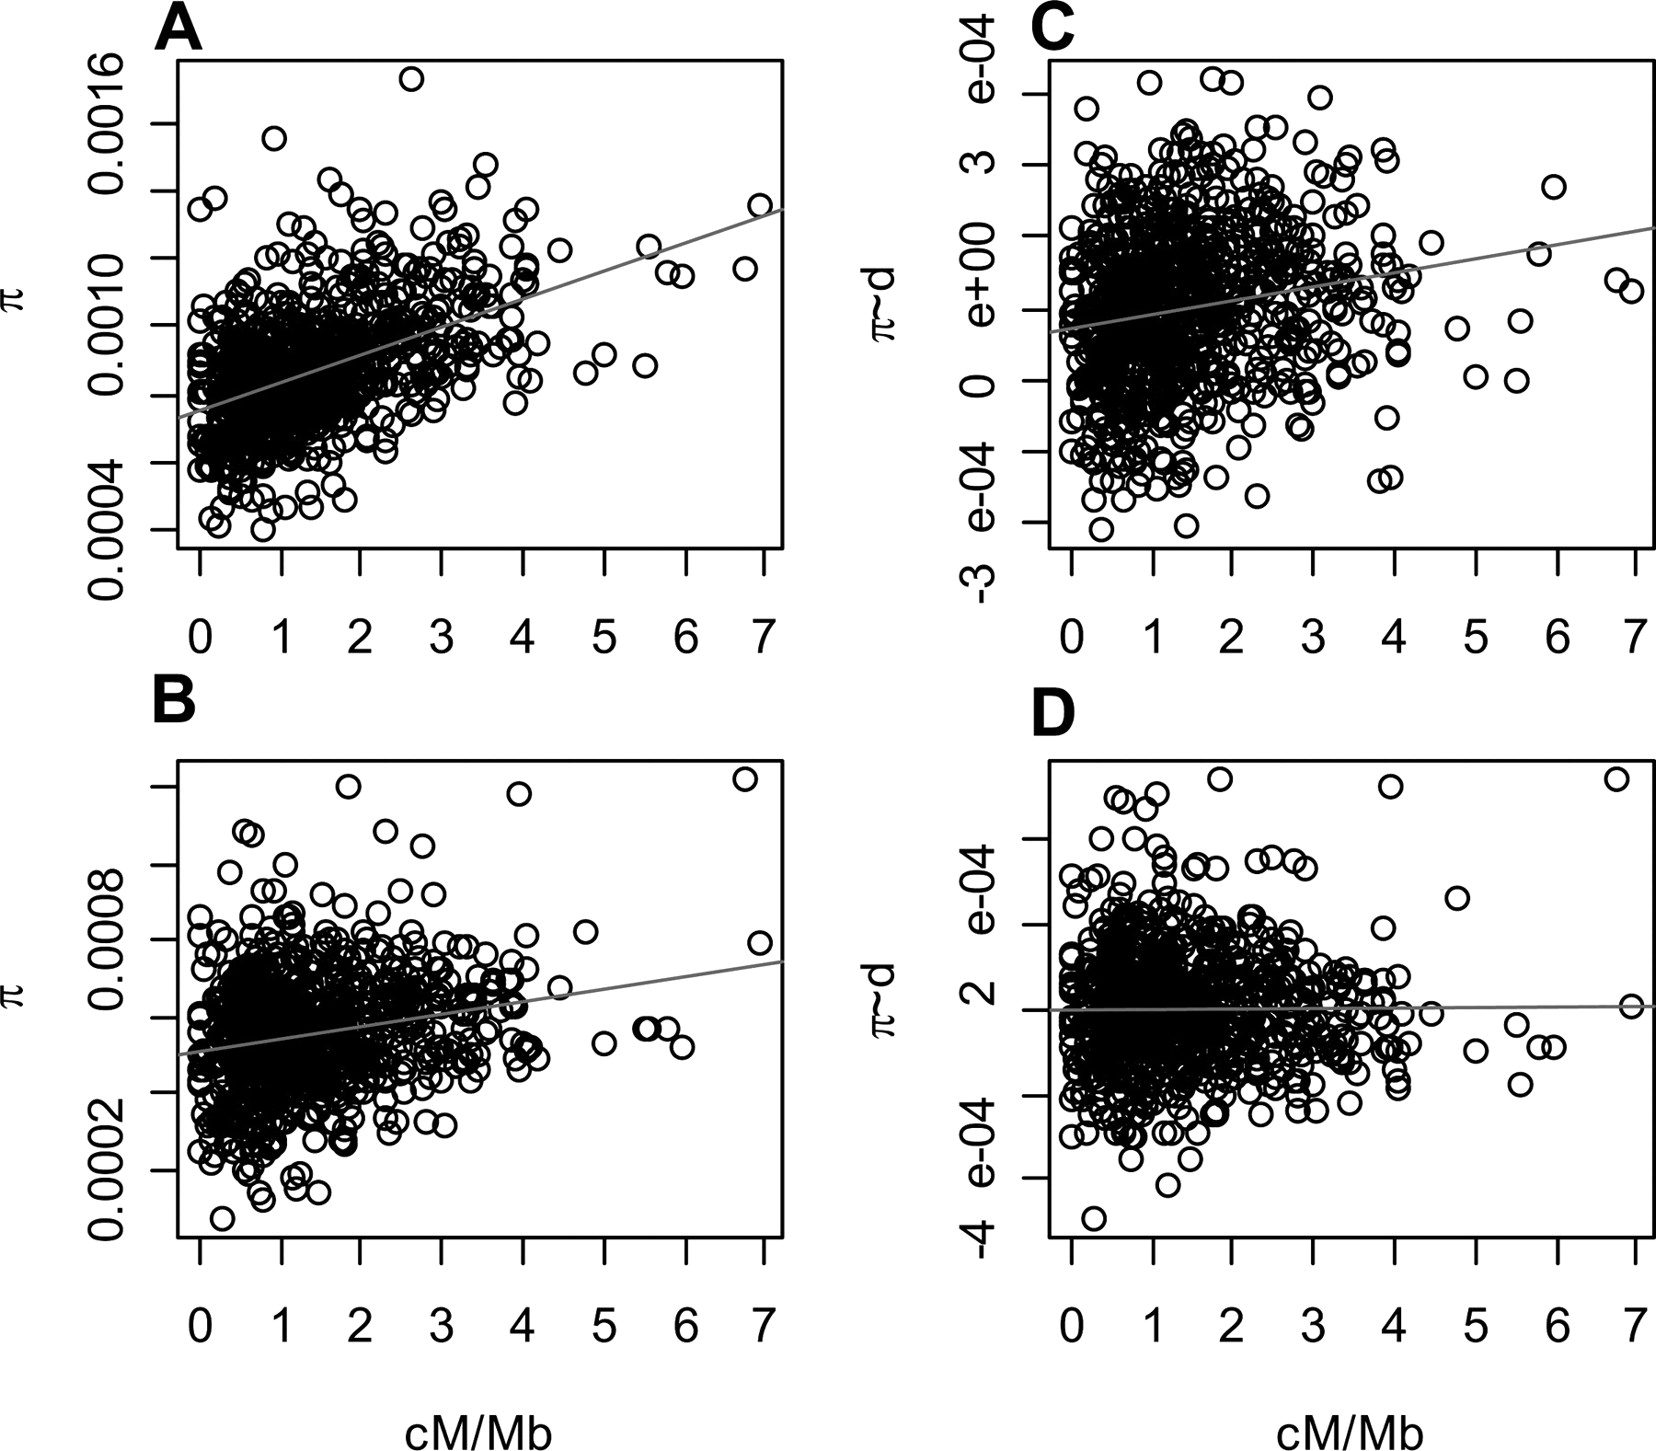
Figure 2.
Human recombination rates are the strongest predictor of (A) human diversity (R2 = 0.164, p <10-15) and are also correlated with (B) chimpanzee diversity (R2 = 0.0379, p <10-7). After correcting for the effects of recombination on mutation rate (using human-chimpanzee divergence), we still observe a positive correlation (C) between the residuals of human diversity and recombination rates (R2 = 0.035, p <10-6), but not (D) between the residuals of chimpanzee diversity and human recombination rates (R2 = 0.0022, p = 0.10).


