
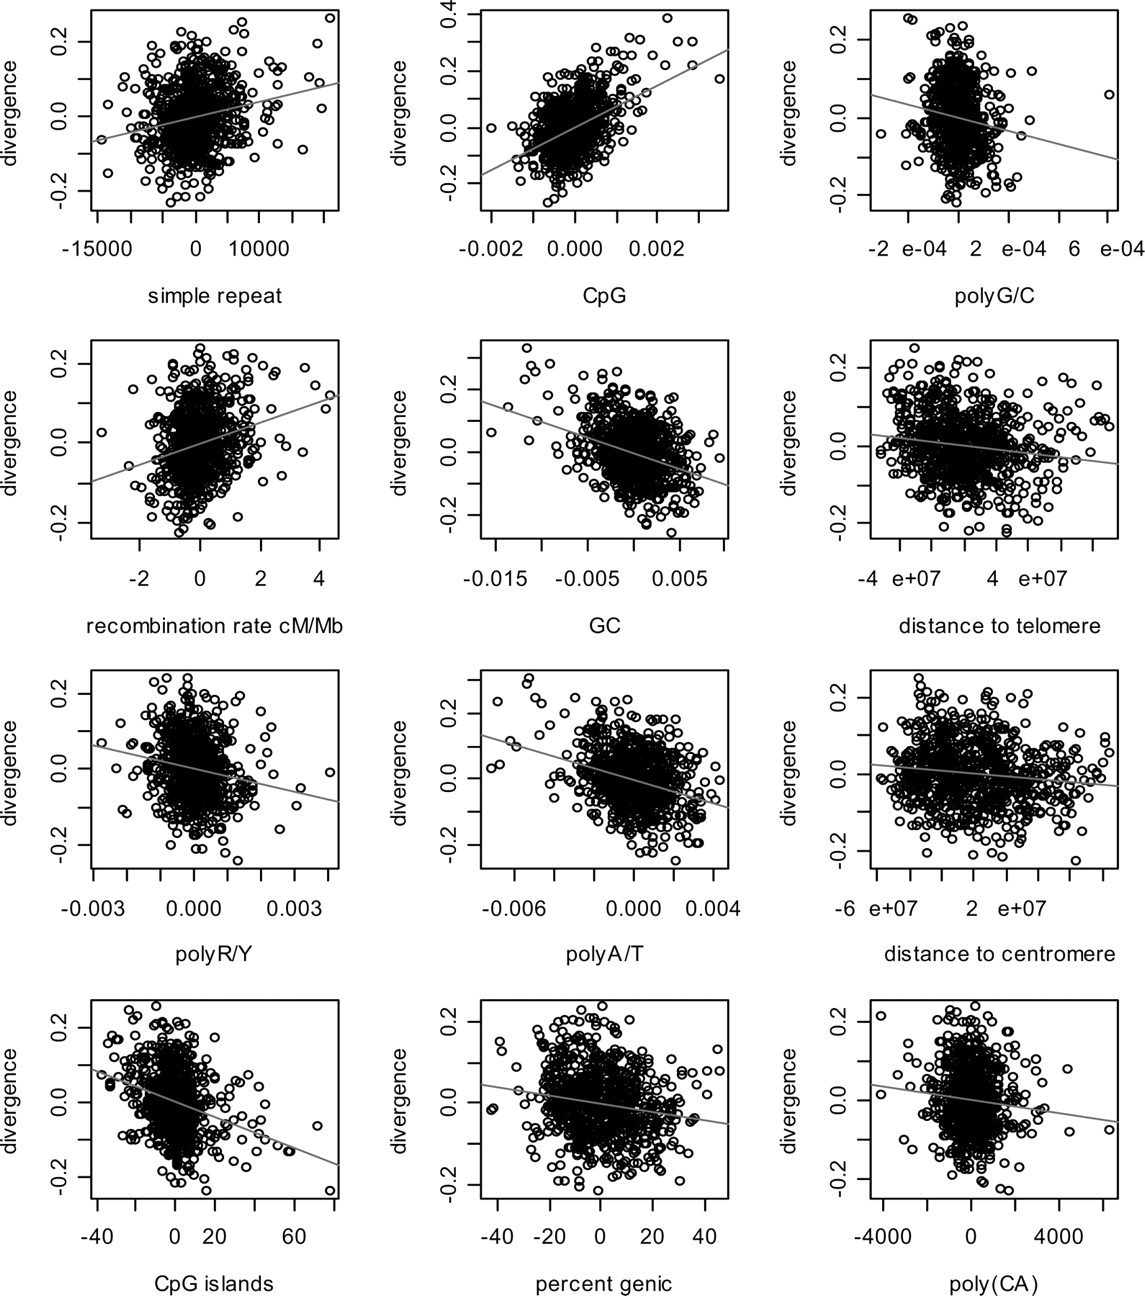
Figure 1.
Scatterplots of the residuals from the full multiple linear regression of non-repeat human-chimpanzee divergence on each significant predictor variable. To assess which factors influence mutation rates, we focus here on the divergence data, which is more precise and extensive than our diversity estimates. The analogous plots for diversity are in Supplemental Figure 1.


