
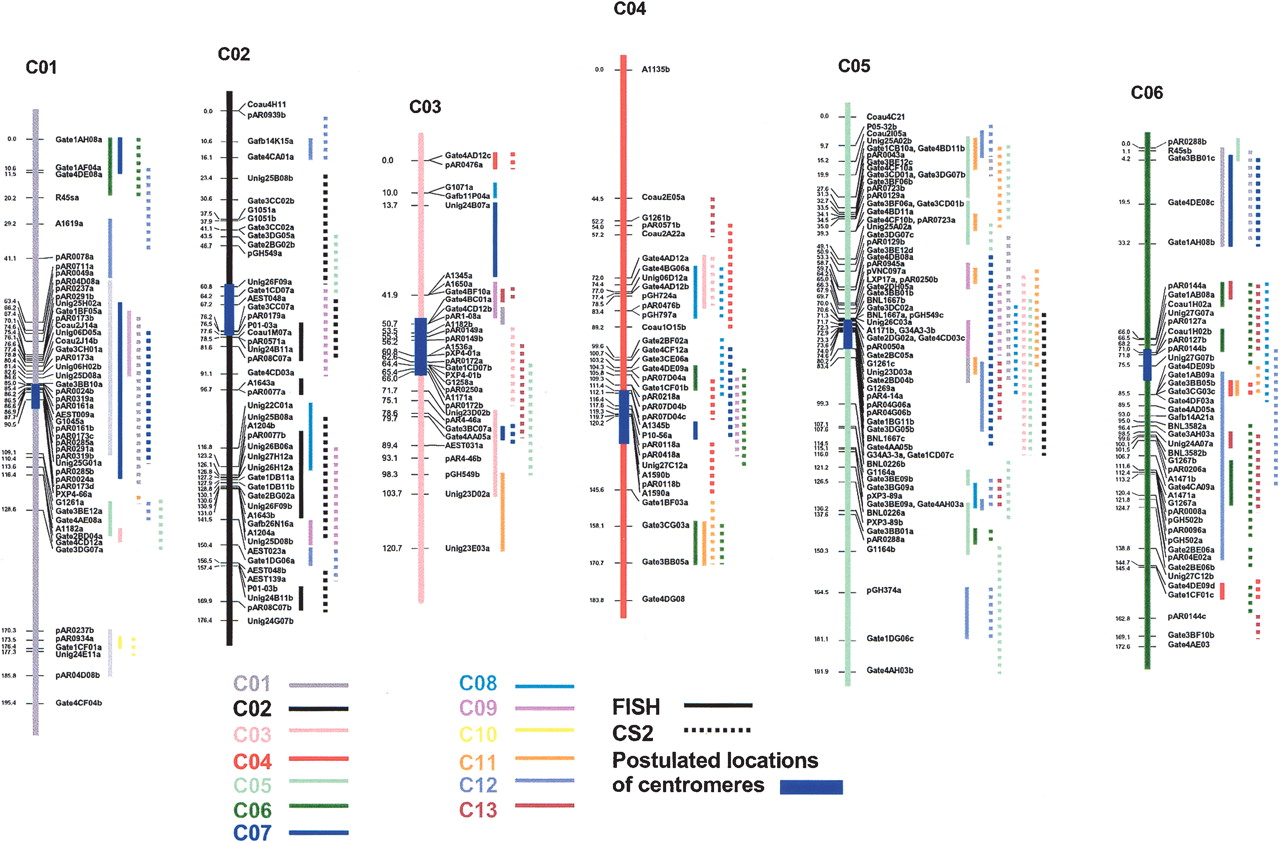
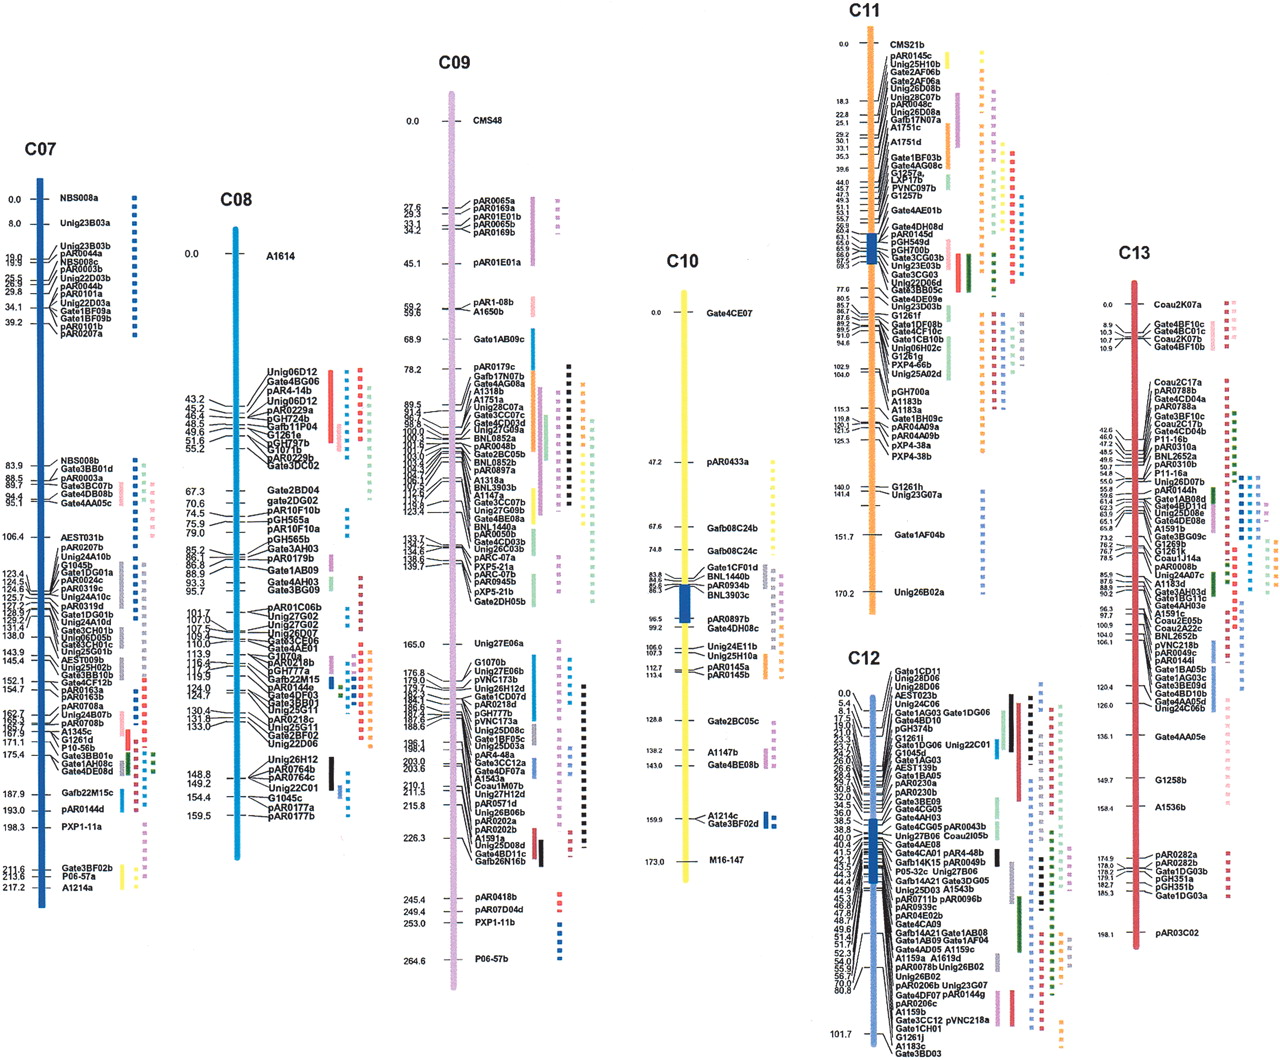
Figure 4.
Duplication in hypothetical ancestral cotton chromosomes. This map includes only those sequence-tagged probes mapped on two or more places and showing the duplications. The vertical bars highlighted with blue on the map represent the possible locations of centromeres (see Fig. 1B). Solid and broken vertical lines beside the markers represented the duplicated regions detected with FISH and CS2, respectively. The 13 colors identified the chromosomes containing duplicated regions, as shown in the legend.


