
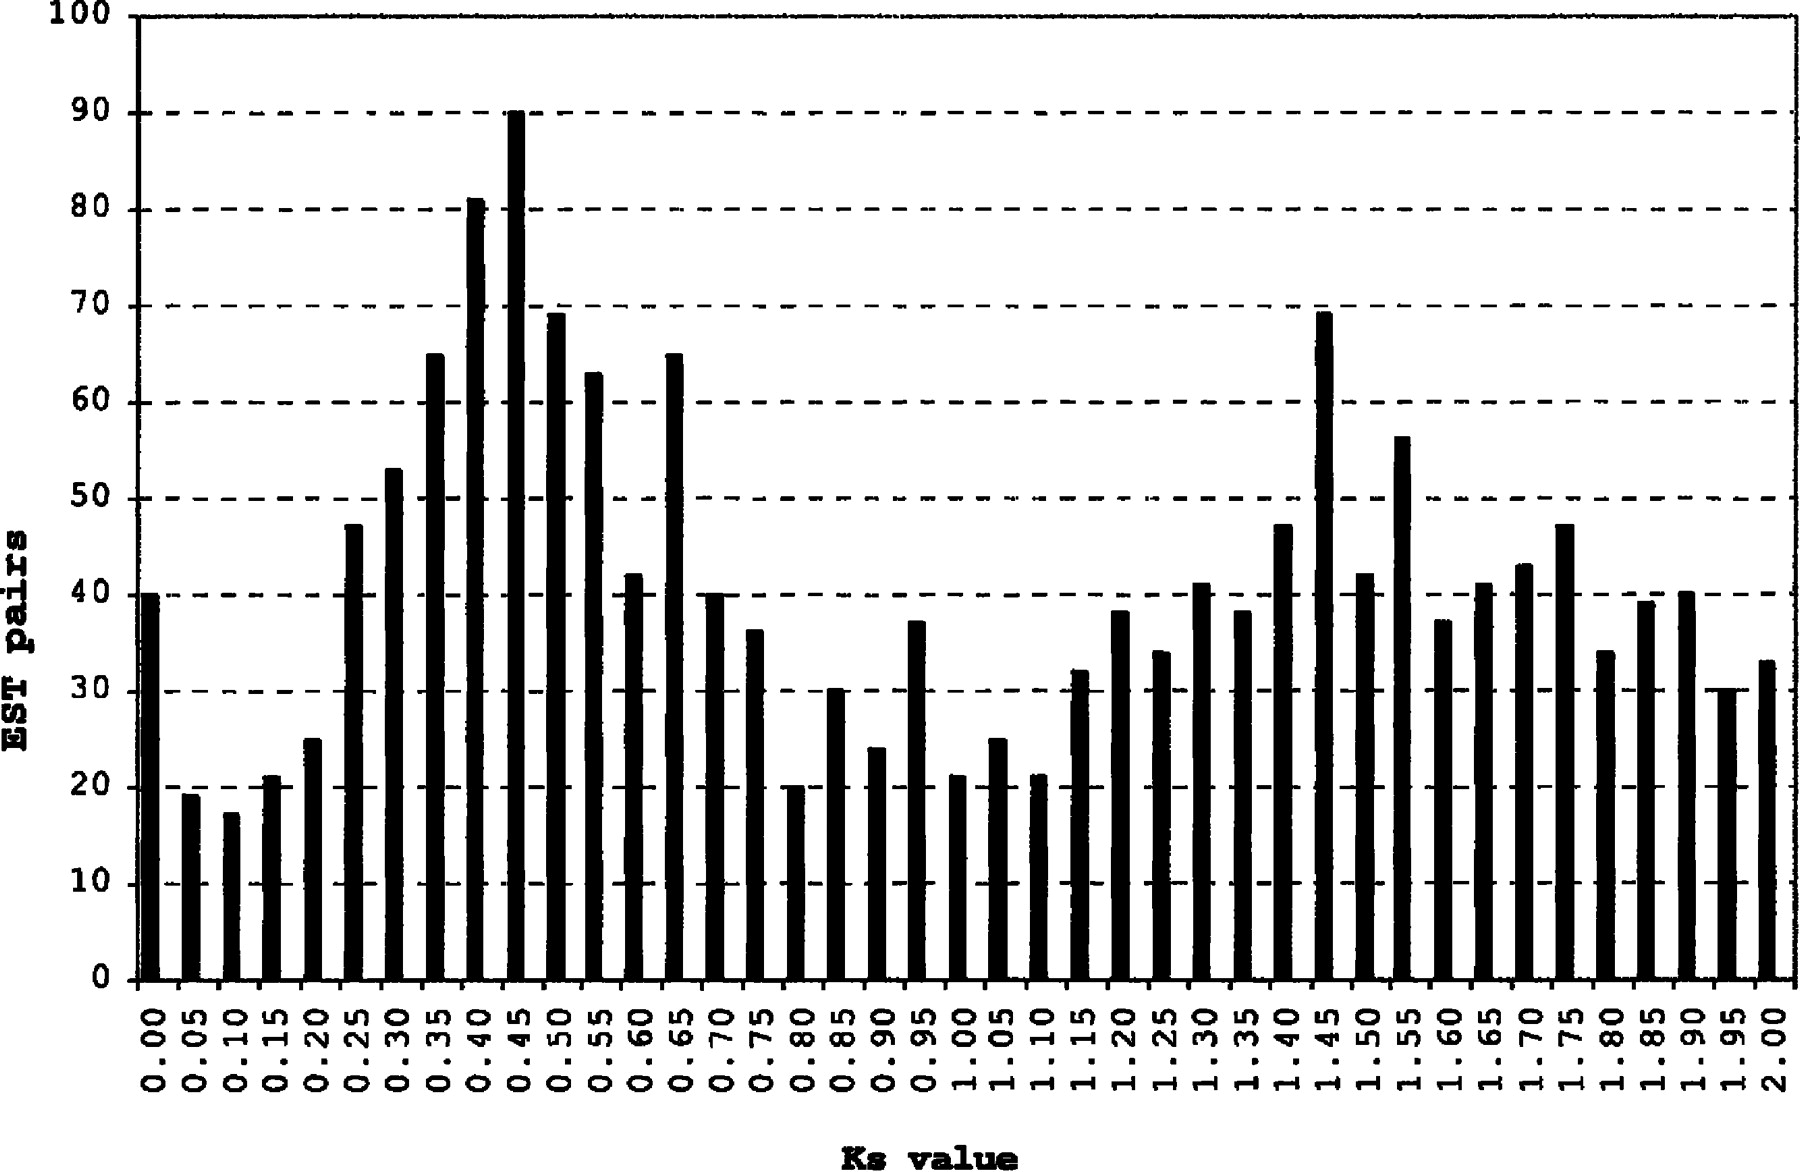
Figure 3.
Patterns of DNA sequence similarity mong G. arboreum ESTs. By analyses described in the text, similarity among best-matching sequences shows a marked peak at a Ks value of about 0.45, suggestive of a large-scale duplication about 15-30 Mya, depending on the neutral substitution rate used (Gaut et al. 1996; Koch et al. 2000).


