
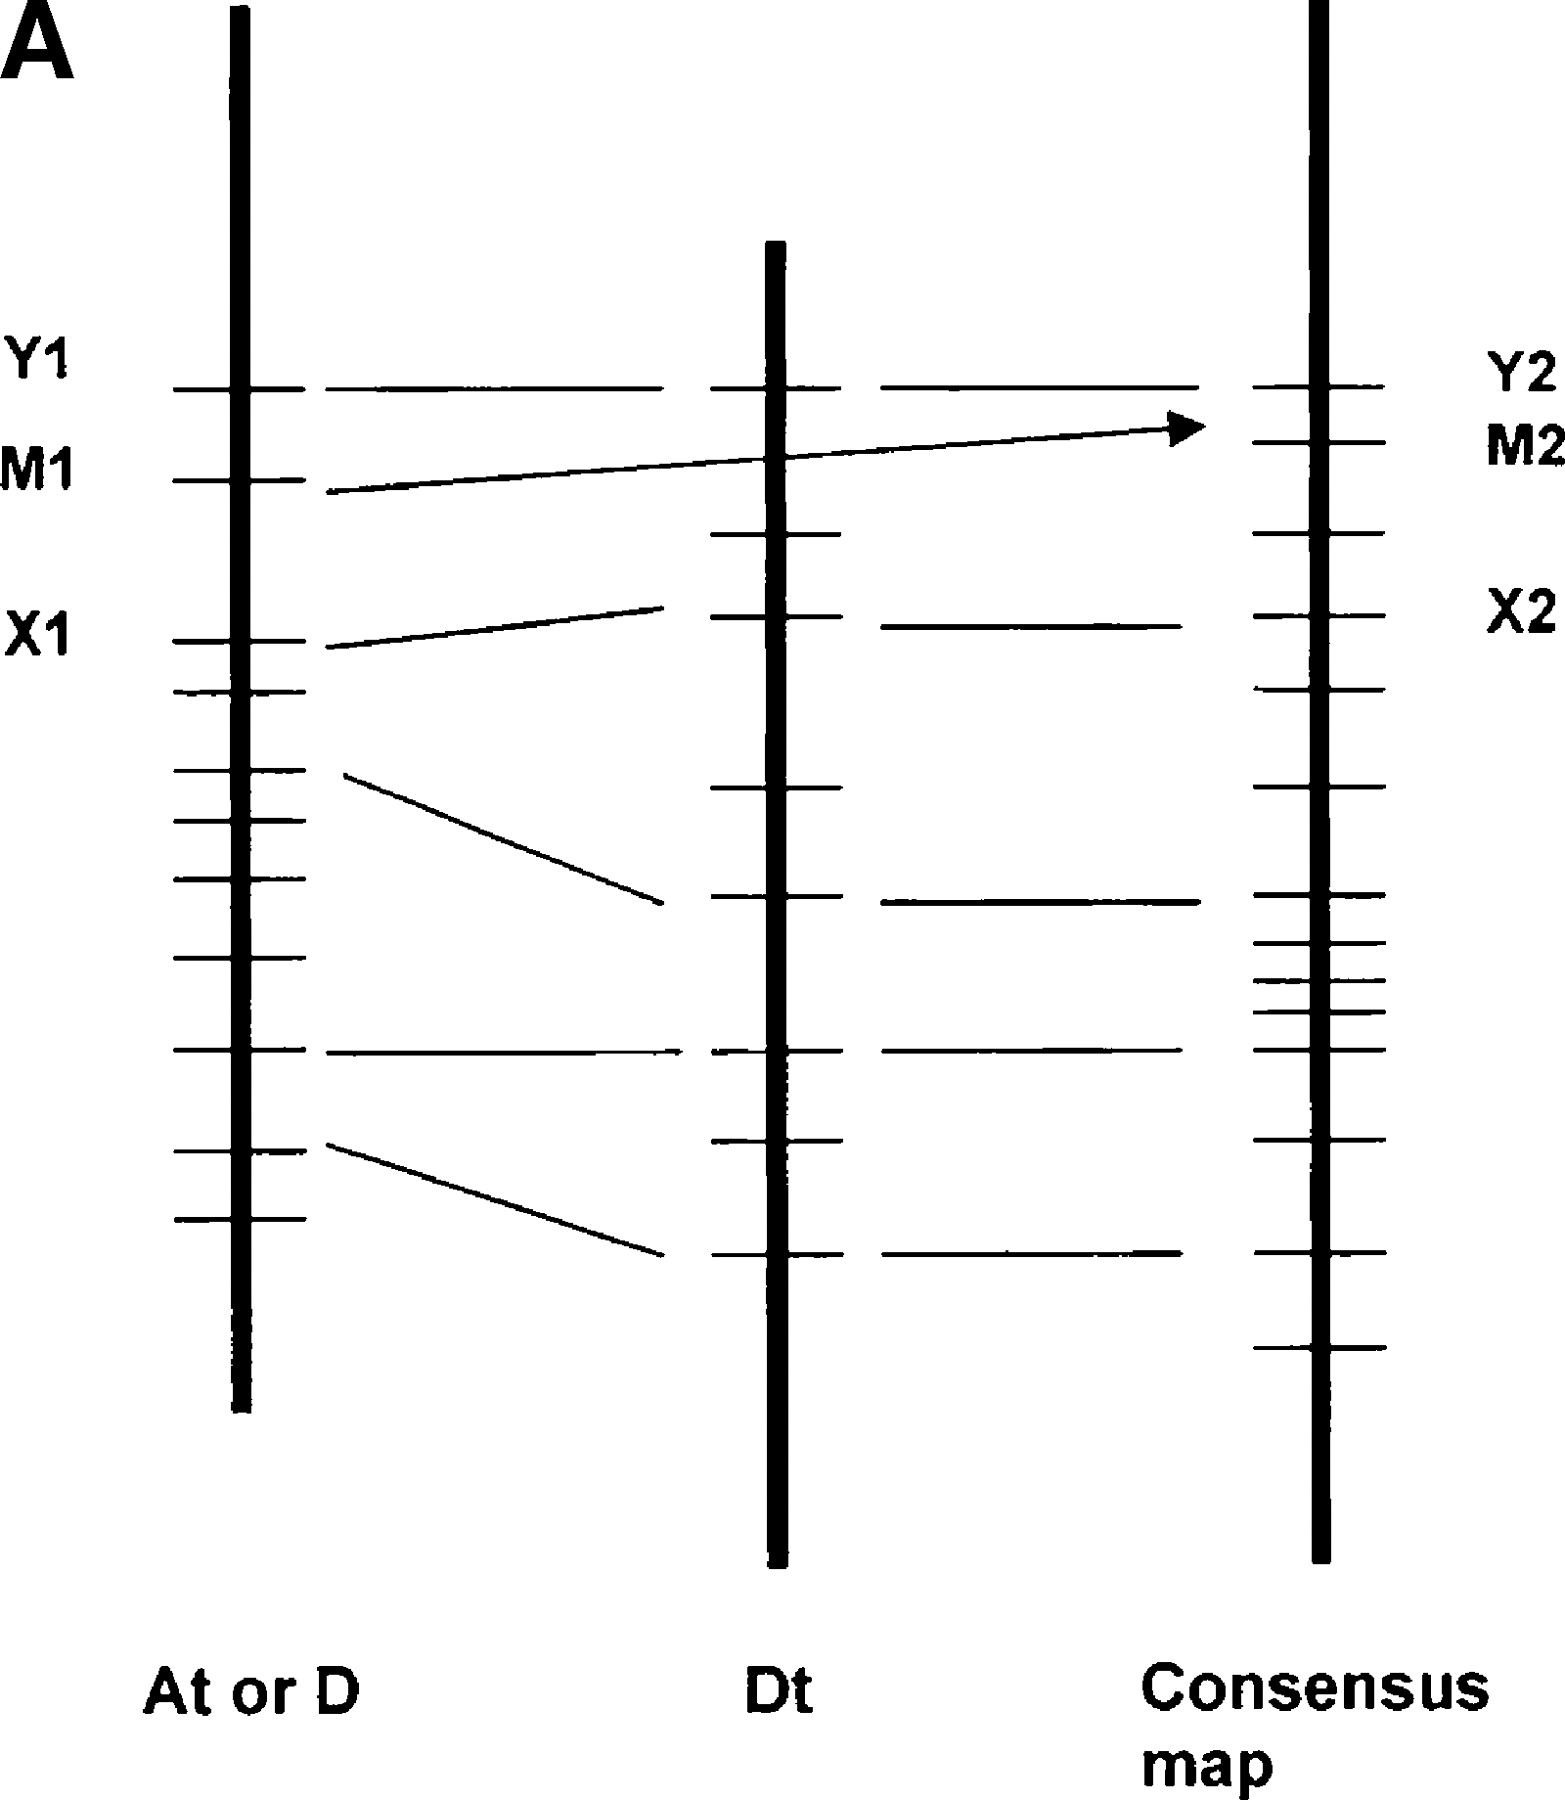
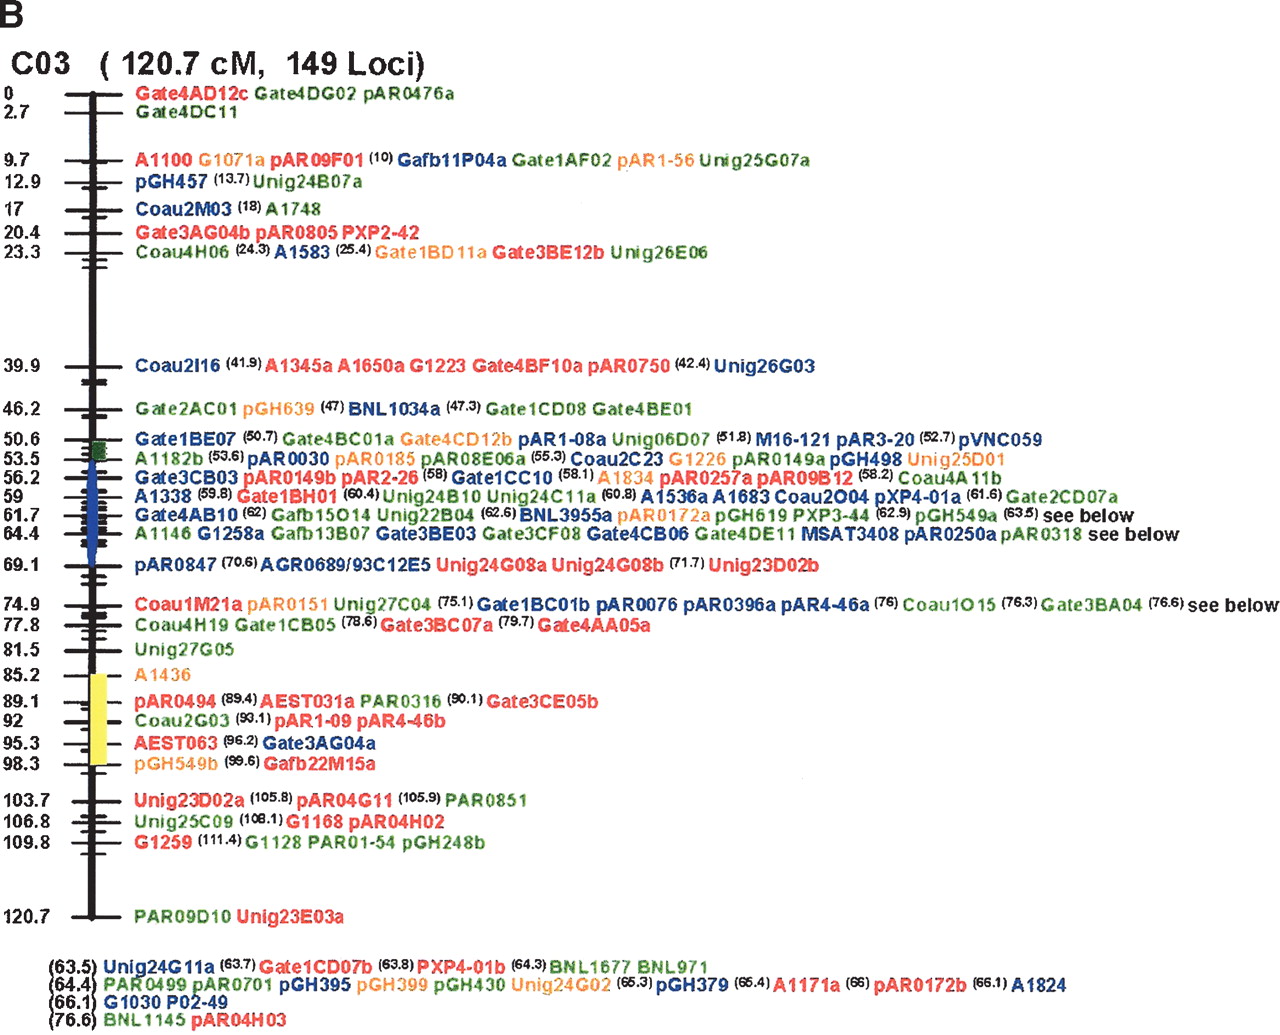
Procedure and example of inferring approximate gene order along the chromosomes of a hypothetical common ancestor of the cotton subgenomes. (A) Illustration of consensus map assembly process. A framework of DNA markers that mapped to homoeologous sites (e.g., X1/X2 and Y1/Y2) were used to interpolate the probable locations of additional markers (e.g., M1/M2) that could be mapped in only a subset of the homoeologs (for details, see Methods). (B) Consensus map of cotton homoeologous group 3 (Chr.3, Chr14/17, and D3), as an example. Markers colored with green, blue, and red were originally from At, Dt, and diploid D chromosomes, respectively. Markers colored with brown were common to two or more homoeologous chromosomes. Vertical bars colored with yellow and green represented inverted regions on diploid D and At chromosomes, respectively, compared with the inferred map. The vertical ellipses highlighted with blue represent possible locations of centromeres, inferred as described elsewhere (Rong et al. 2004). Superscripted numbers in parentheses indicate centiMorgan locations that could not be shown between major gridlines on the map due to space, followed by markers at those locations. Markers below the maps also could not be shown at the centiMorgan locations indicated (parentheses), due to space.


