
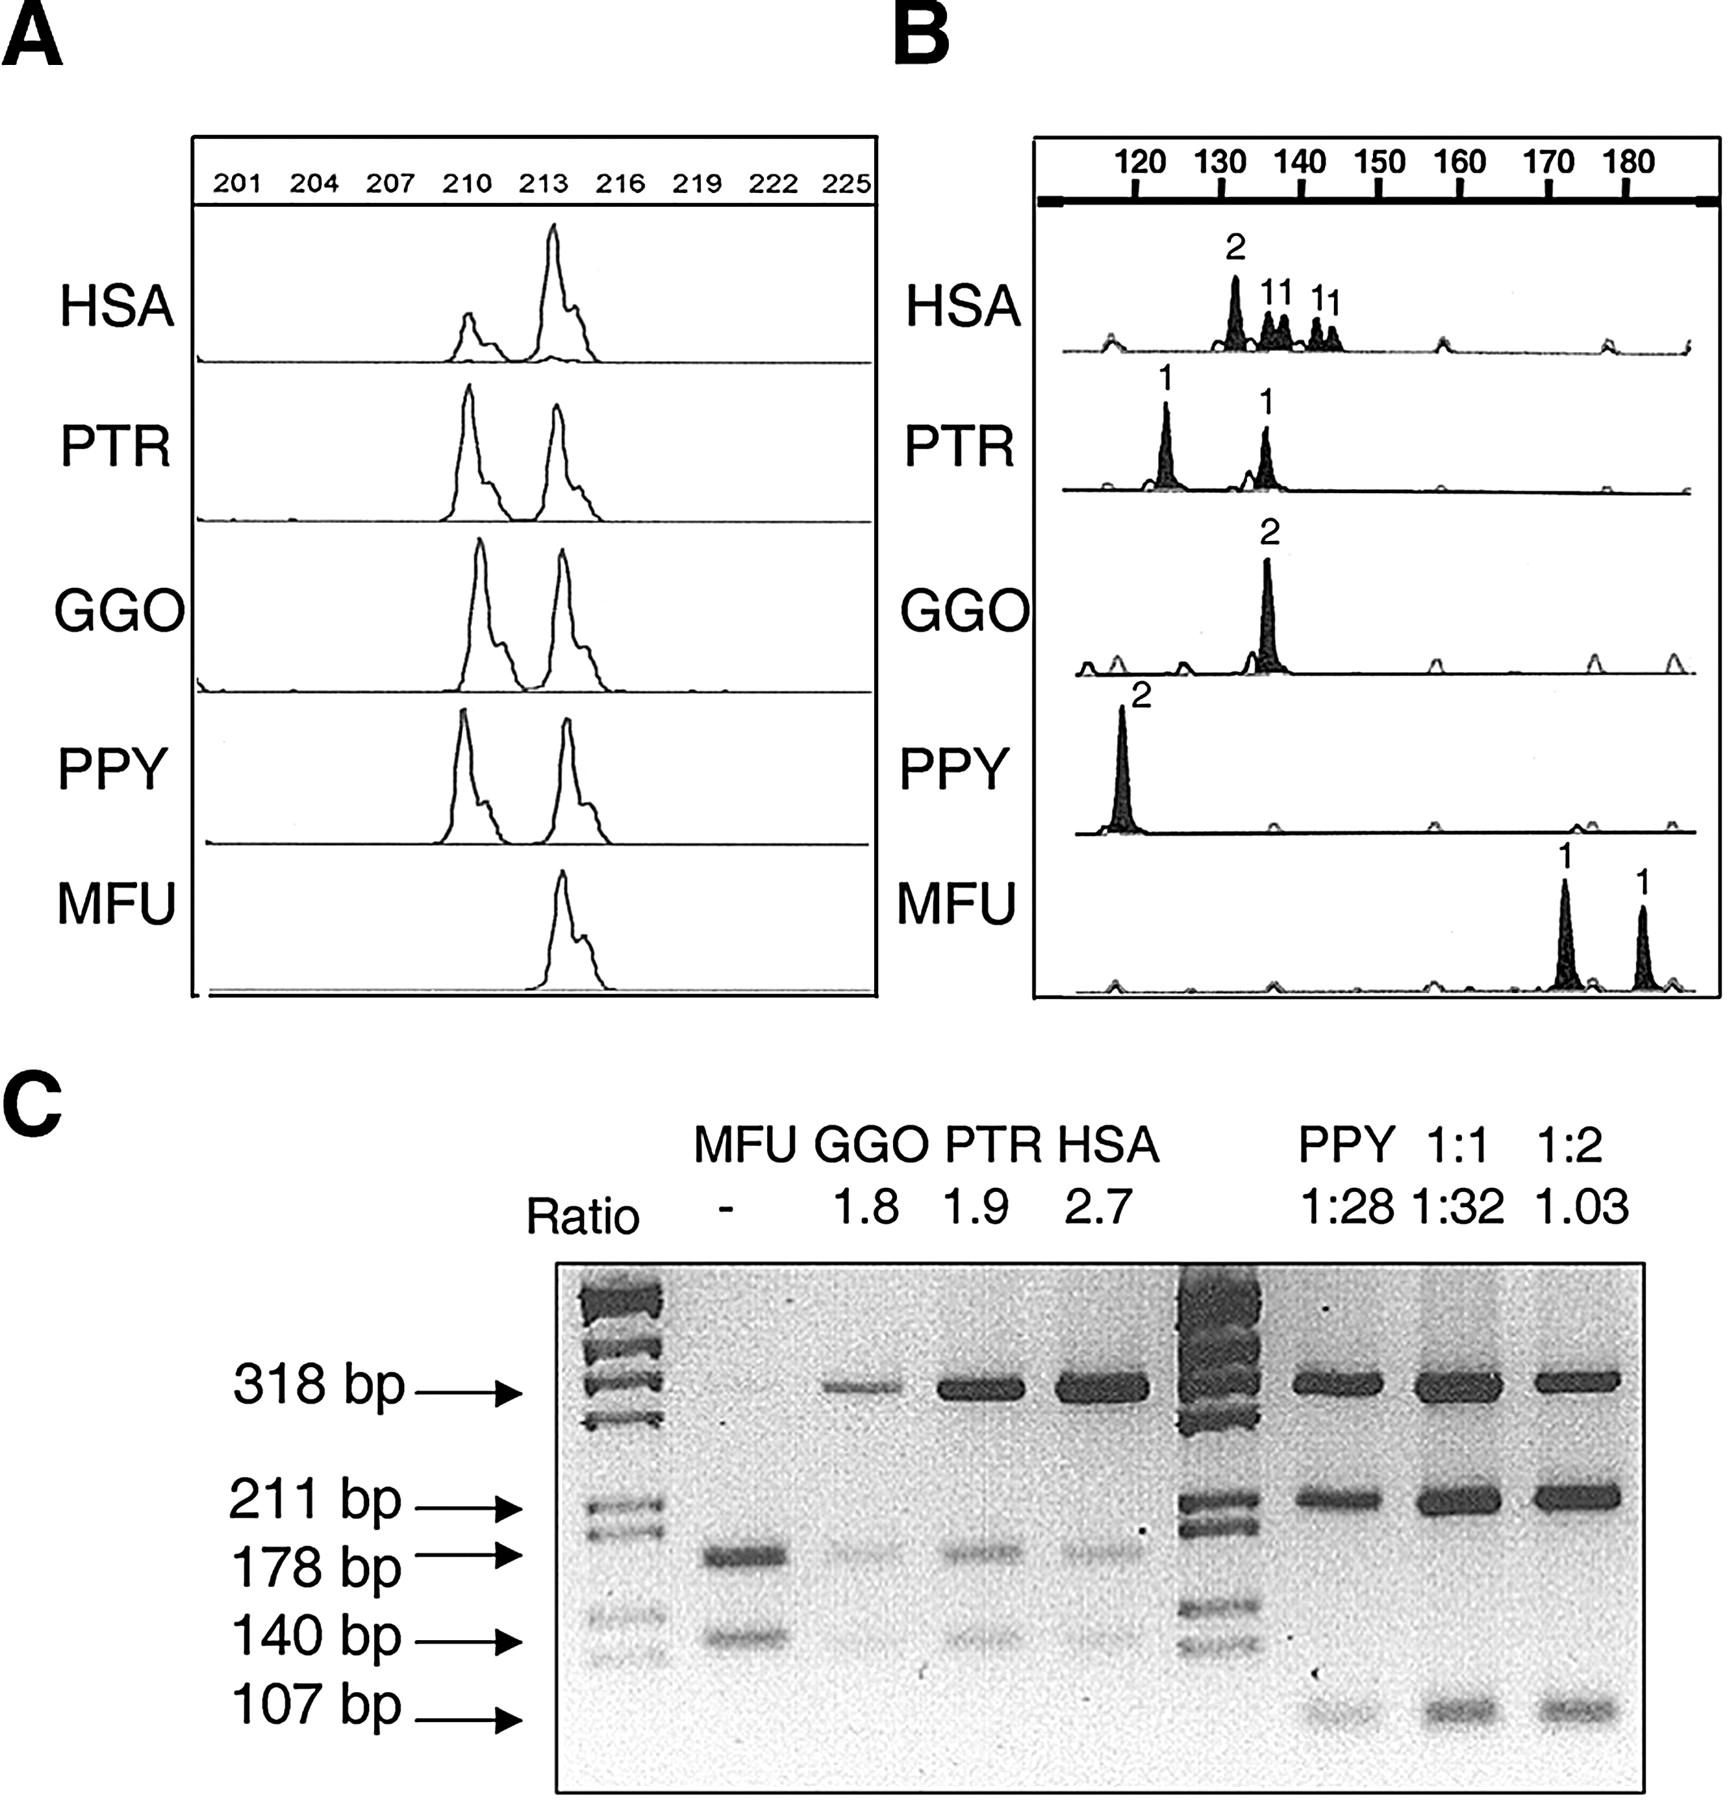
Representative assays of copy number quantification in human (HSA), chimpanzee (PTR), gorilla (GGO), orangutan (PPY), and macaque (MFU) DNA, by comparison of paralogous sequence variants (PSVs) and microsatellites located in the segmental duplications. (A) A deletion/insertion PSV in block A distinguishes the ancestral STAG3 gene copy with respect to the pseudogene copies L1, L2, and L3. The STAG3/STAG3L copy ratio calculated for each species was: 0.47 ± 0.1 in HSA, 1.09 ± 0.1 in PTR, 1.04 ± 0.06 in GGO, and 0.95 ± 0.1 in PPY. Numbers on top show the amplimer size (in bp). (B) A microsatellite located between NCF1 and GTF2I in block B (BBSTR1, Bayés et al. 2003). All nonhuman primates displayed one or two alleles indicative of a single locus, whereas humans revealed six alleles corresponding to three different loci. The number of inferred alleles is indicated over each peak. (C)A restriction assay for a PSV of the TRIM50 gene in block C. In all primates but orangutan, there was a differential restriction site for NgoMIV. In orangutan, another assay with MluNI was performed and compared with artificial situations displaying 1:1, 2:1 ratios. Ratios between restriction products are shown at the top of each sample.


